Fig. 7.
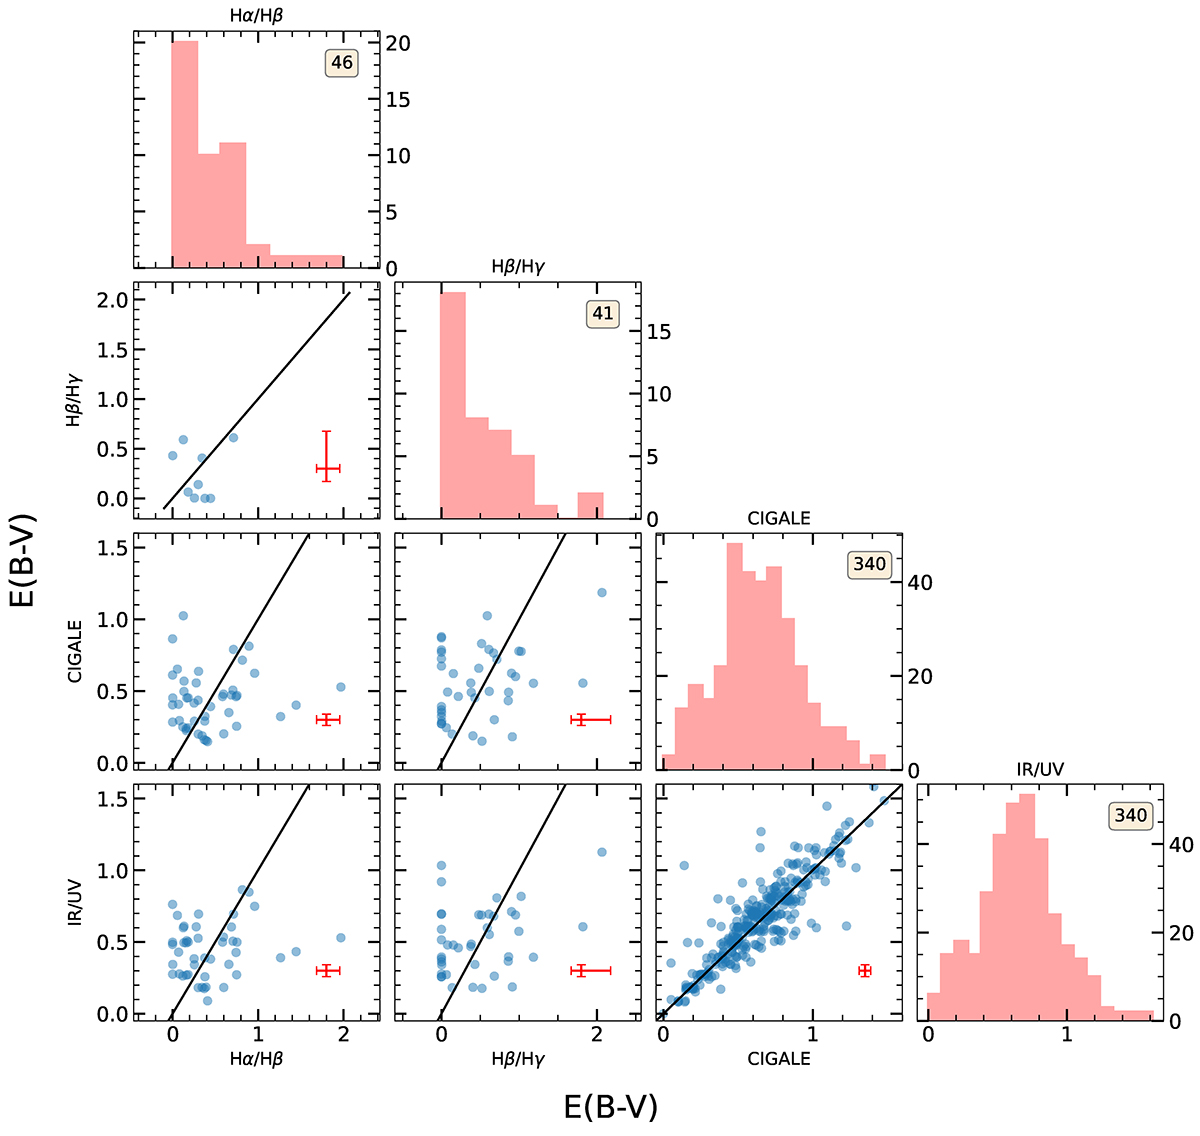
Download original image
Histograms and comparisons of the colour excesses obtained using the tracers analysed in this article. The black lines indicate the relationship x = y. The values in the inset boxes refer to the number of objects for which the colour excess could be calculated with the respective tracer. The average 1σ size is shown in red at the bottom right of each panel.
Current usage metrics show cumulative count of Article Views (full-text article views including HTML views, PDF and ePub downloads, according to the available data) and Abstracts Views on Vision4Press platform.
Data correspond to usage on the plateform after 2015. The current usage metrics is available 48-96 hours after online publication and is updated daily on week days.
Initial download of the metrics may take a while.