Fig. 3.
Download original image
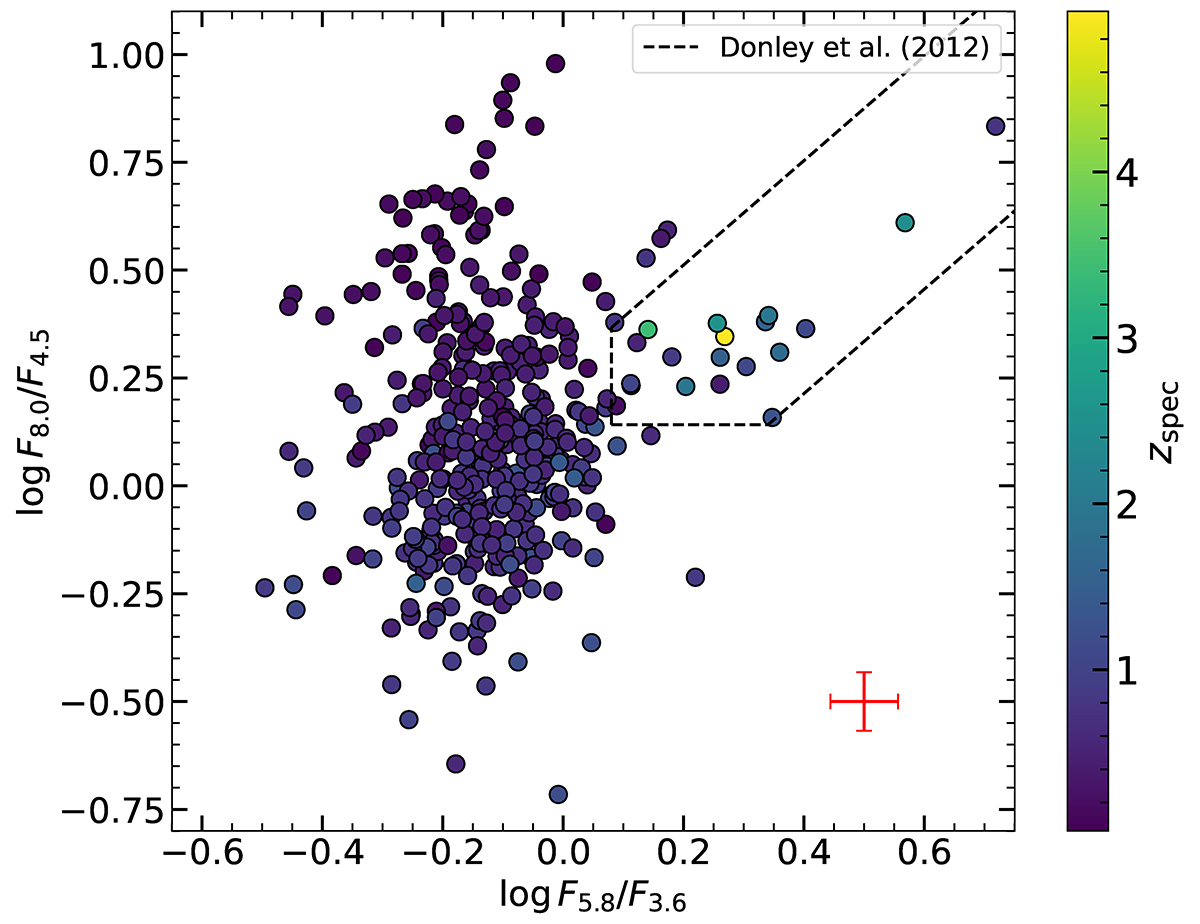
Criteria for separating AGN from SFGs, using Spitzer/IRAC bands, updated by Donley et al. (2012). The x-axis represents the ratio of fluxes in the 5.8 μm and 3.6 μm bands, while the y-axis represents the ratio of fluxes in the 8.0 μm and 4.5 μm bands. The area bounded by the black dashed lines corresponds to the selection criterion defined by Donley et al. (2012). The colour-coding represents the spectroscopic redshift of the objects. The average 1σ size is shown in red at the bottom right.
Current usage metrics show cumulative count of Article Views (full-text article views including HTML views, PDF and ePub downloads, according to the available data) and Abstracts Views on Vision4Press platform.
Data correspond to usage on the plateform after 2015. The current usage metrics is available 48-96 hours after online publication and is updated daily on week days.
Initial download of the metrics may take a while.