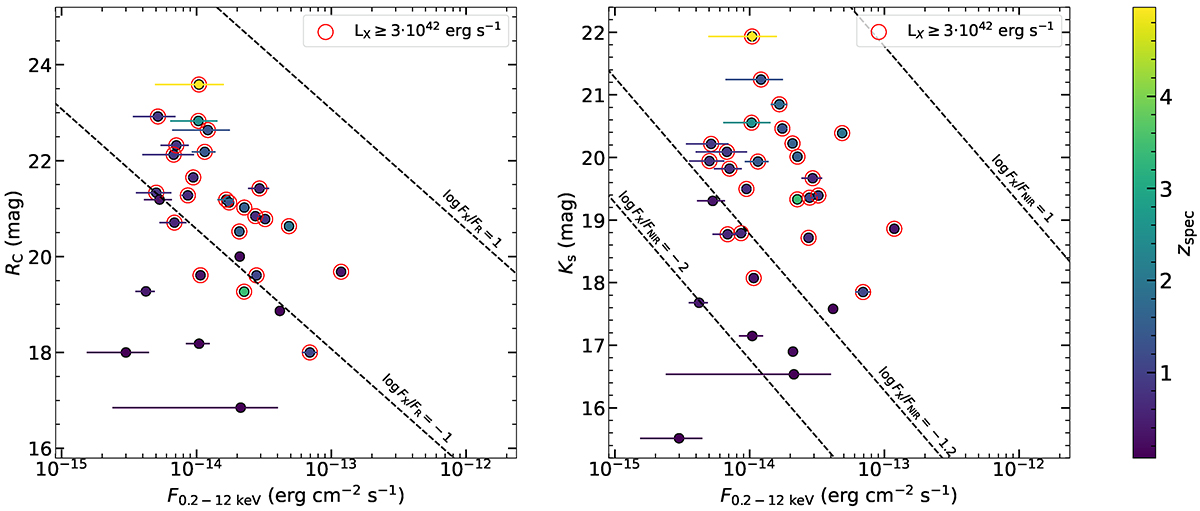
Fig. 2.
Download original image
AGN classification based on X/O and X/NIR ratios. The left panel illustrates the relationship between X-ray flux (0.2–12 keV) and RC magnitude. Dashed lines represent the thresholds for log(X/O) > −1 and log(X/O) > 1, with objects above log(X/O) > −1 classified as AGN. Red circles highlight points meeting the AGN criterion LX > 3 × 1042 erg s−1 of Xue et al. (2011). Colour coding indicates the spectroscopic redshift of the objects. The right panel displays the X-ray flux plotted against Ks magnitude. Objects above the log(X/NIR) > −1.2 threshold are categorised as AGN. Red circles and colour-coding are the same as in the left panel.
Current usage metrics show cumulative count of Article Views (full-text article views including HTML views, PDF and ePub downloads, according to the available data) and Abstracts Views on Vision4Press platform.
Data correspond to usage on the plateform after 2015. The current usage metrics is available 48-96 hours after online publication and is updated daily on week days.
Initial download of the metrics may take a while.