Fig. 14.
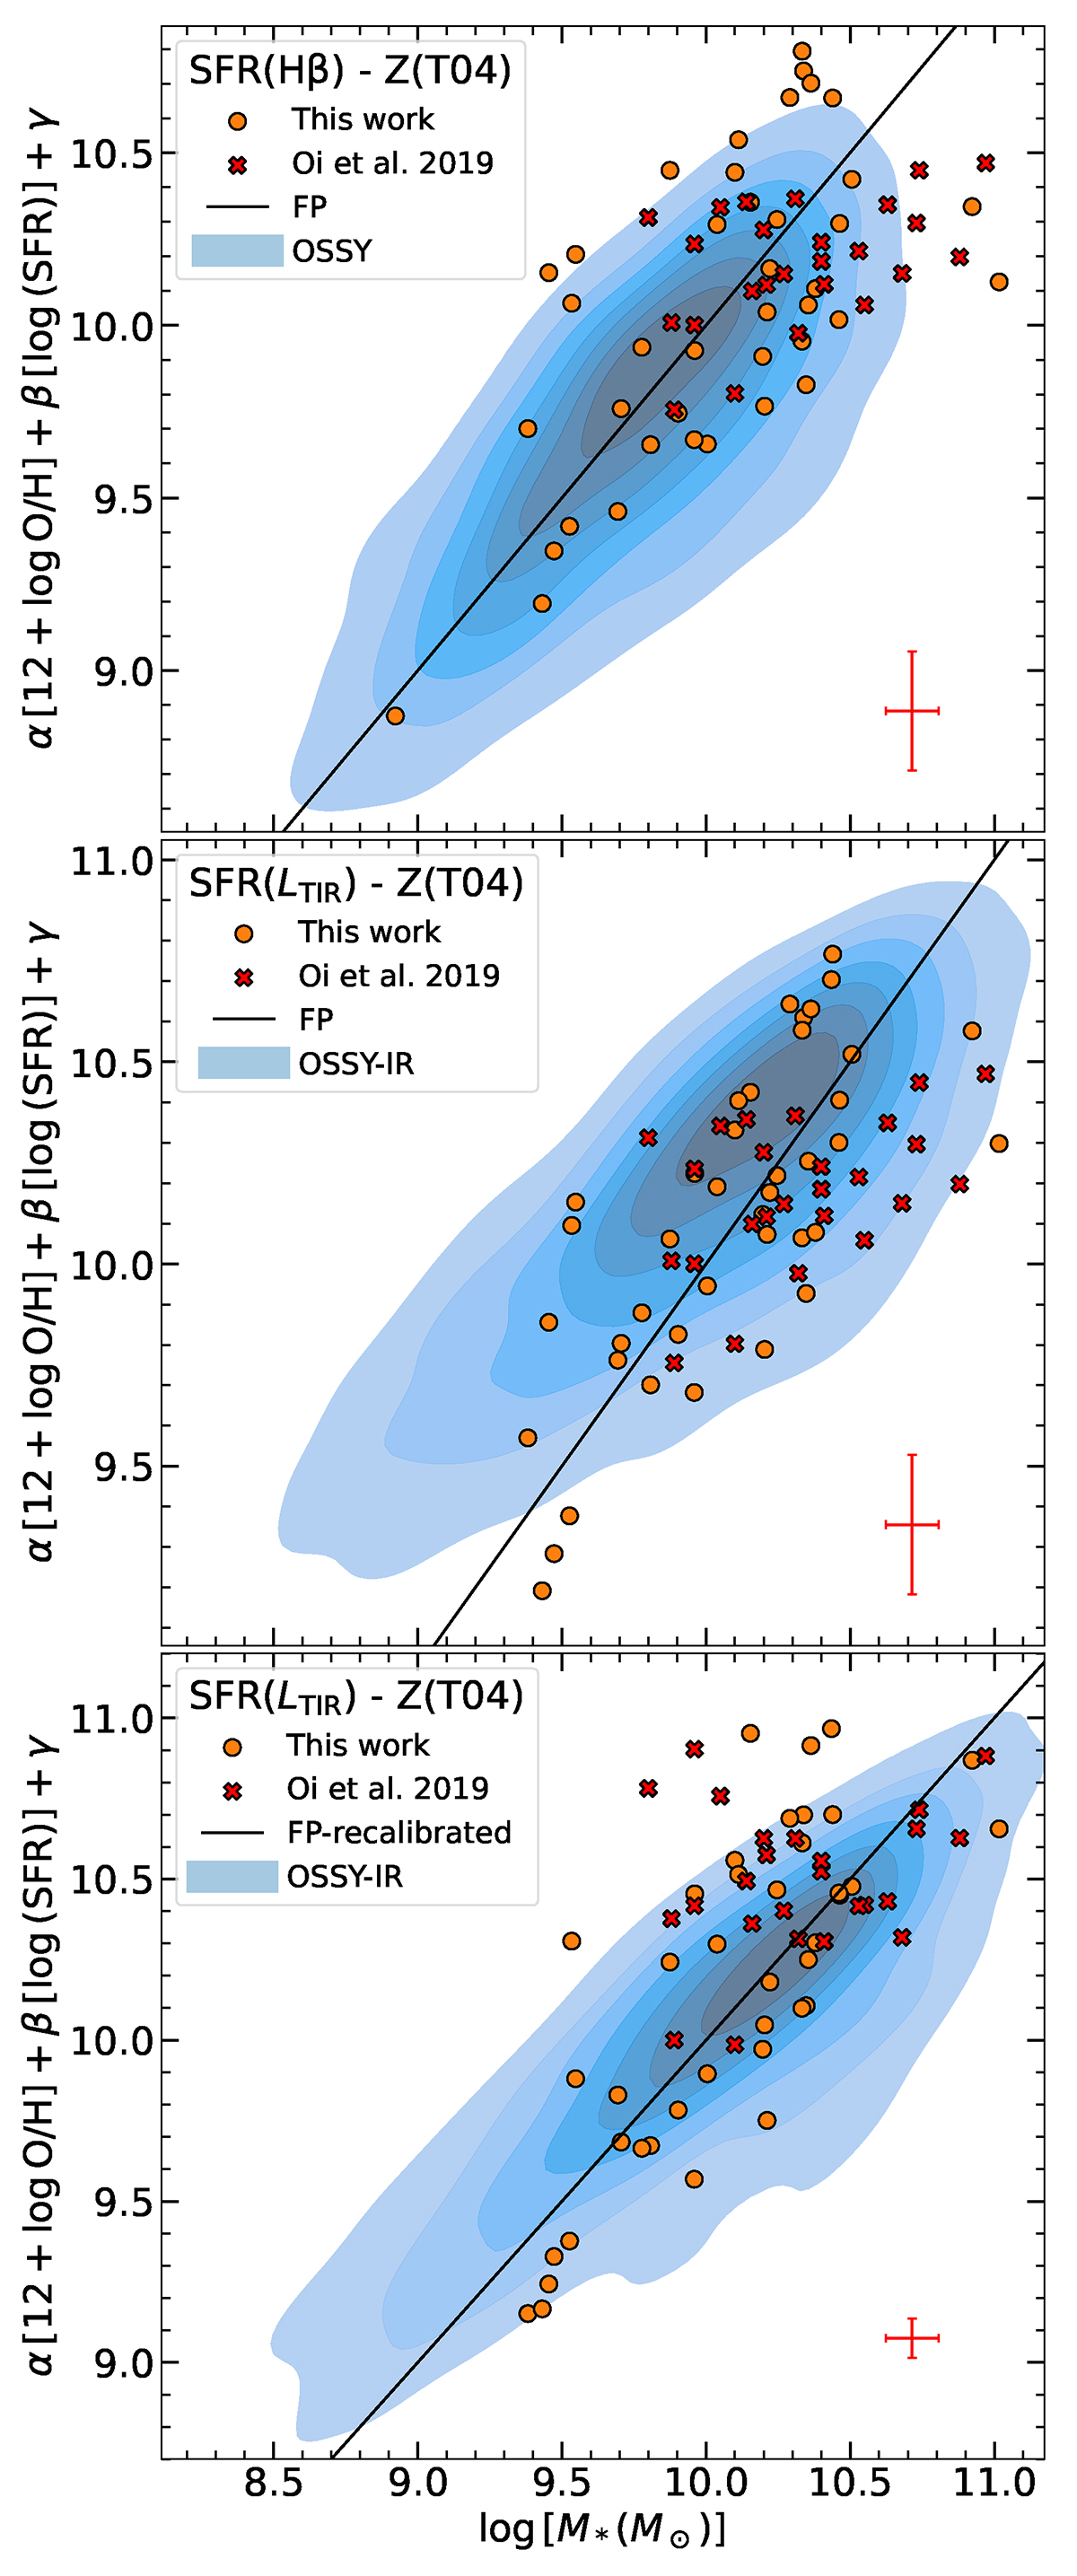
Download original image
Projection of the FP onto the M* coordinate against the observed M*. In the top panel we have used the SFR derived from the Hβ flux, the metallicity using the Tremonti et al. (2004) calibration and the Lara-López et al. (2013a) parametrisation. The orange dots are the Lockman-SpReSO SFGs, the red crosses are the Oi et al. (2017) data and the blue contours at the bottom are the OSSY data. The middle panel shows the same, but with the IR-derived SFR. In the lower panel we show the recalibration of the FP using the OSSY data with IR information to obtain a calibrated FP with the LTIR-derived SFR. A more detailed discussion is given in the text.
Current usage metrics show cumulative count of Article Views (full-text article views including HTML views, PDF and ePub downloads, according to the available data) and Abstracts Views on Vision4Press platform.
Data correspond to usage on the plateform after 2015. The current usage metrics is available 48-96 hours after online publication and is updated daily on week days.
Initial download of the metrics may take a while.