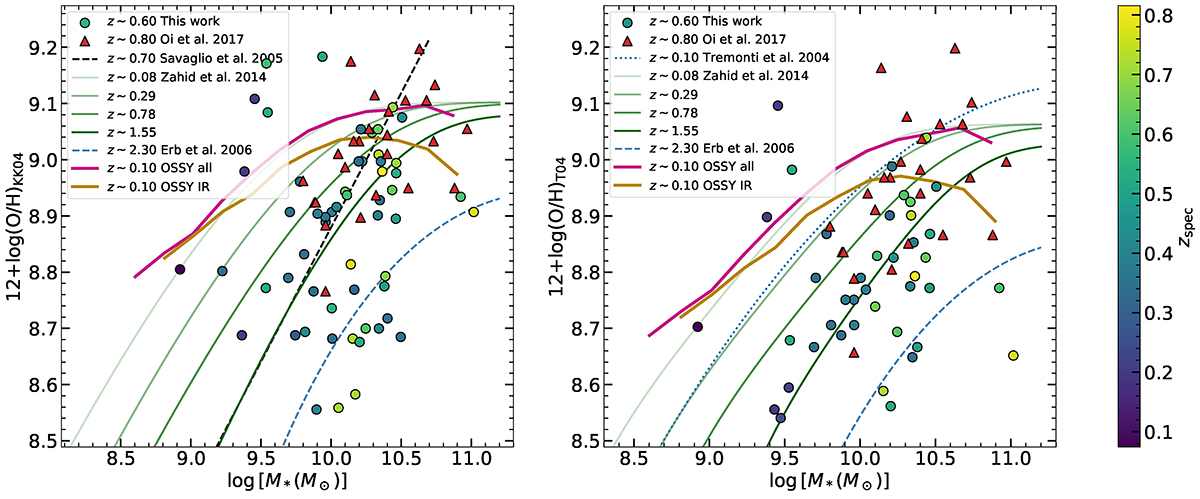
Fig. 13.
Download original image
MZR diagram using the Kobulnicky & Kewley (2004, left) and Tremonti et al. (2004, right) metallicity calibrations. The blue dots represent our Lockman-SpReSO data at a median redshift ∼0.6 and the red triangles represent the Oi et al. (2017) IR galaxies at a median redshift ∼0.8. The magenta line represents the median metallicity for each mass binning of the whole OSSY catalogue, while the brown line represents the same binning but only for the OSSY objects with IR information in HELP. The green lines represent the MZR model from Zahid et al. (2014) applied to galaxies from the SDSS (z ∼ 0.08), SHELS (z ∼ 0.29), DEEP2 (z ∼ 0.78) and COSMOS (z ∼ 1.55) surveys. The black dashed line represents the linear MZR model obtained by Savaglio et al. (2005) for 60 galaxies with an average redshift of z ∼ 0.7. In both the OSSY catalogue and the Lockman objects, it can be seen that, except at the higher masses of the sample, IR objects tend to be less metallic than optical objects at the same redshift. The blue dashed line shows the MZR obtained by Erb et al. (2006) for a sample of UV-selected SFGs at z ∼ 2.3.
Current usage metrics show cumulative count of Article Views (full-text article views including HTML views, PDF and ePub downloads, according to the available data) and Abstracts Views on Vision4Press platform.
Data correspond to usage on the plateform after 2015. The current usage metrics is available 48-96 hours after online publication and is updated daily on week days.
Initial download of the metrics may take a while.