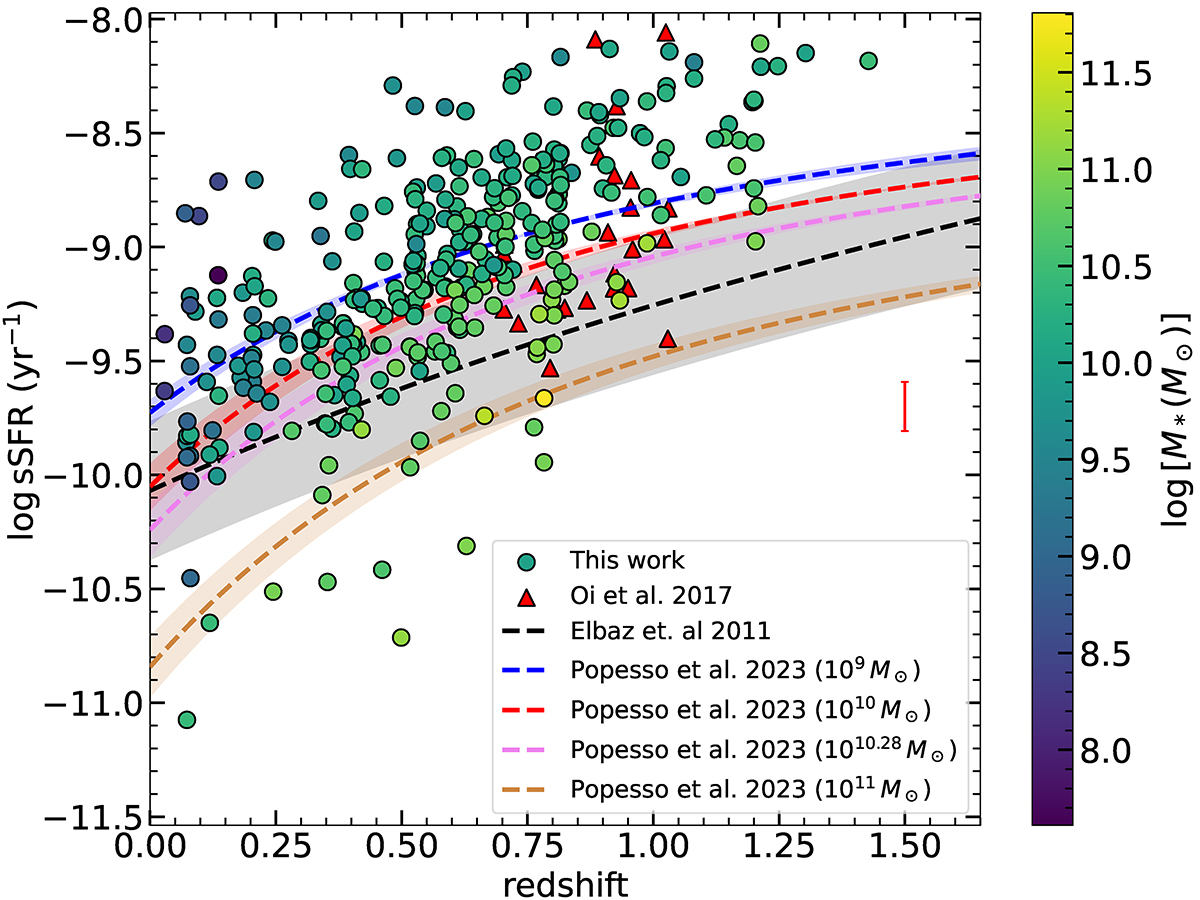
Fig. 11.
Download original image
Redshift and M* evolution of the sSFR for SFG. The circles represent the Lockman-SpReSO galaxies, colour-coded by M*. The MS defined by Popesso et al. (2023) is shown in magenta for the mean M* and in blue, red and brown for log M* (M⊙) set to 9, 10, and 11, respectively. The black line is the MS defined by Elbaz et al. (2011) for IR galaxies, assuming independence with M*. The grey shaded region marks the area above which the galaxies are classified as starbursts. The Lockman sample tends to populate this region regardless of the MS used. The galaxies from Oi et al. (2017), shown as red triangles, follow the behaviour of the Lockman-SpReSO objects.
Current usage metrics show cumulative count of Article Views (full-text article views including HTML views, PDF and ePub downloads, according to the available data) and Abstracts Views on Vision4Press platform.
Data correspond to usage on the plateform after 2015. The current usage metrics is available 48-96 hours after online publication and is updated daily on week days.
Initial download of the metrics may take a while.