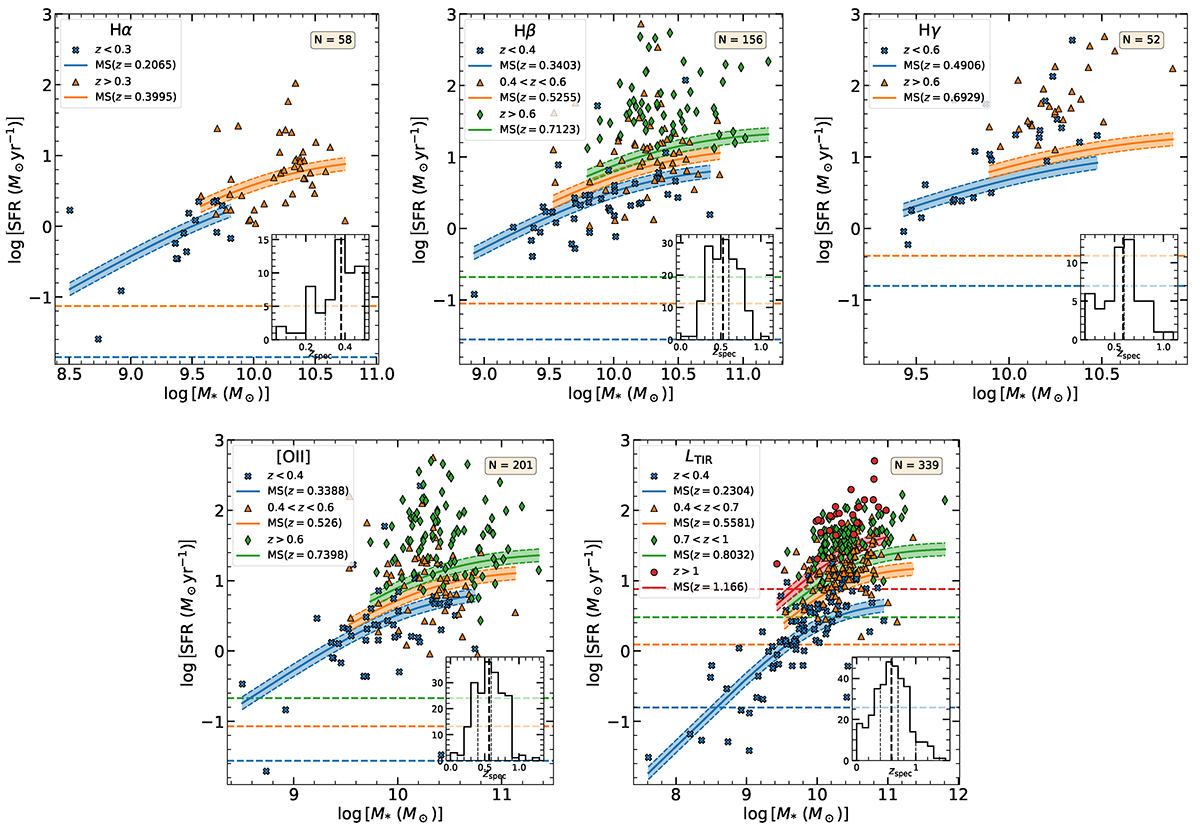
Fig. 10.
Download original image
SFR–M relation for different SFR determination methods. From left to right and top to bottom, the SFR determined using Hα, Hβ, Hγ, [O II], and LTIR fluxes is displayed. Inside each panel the sample was divided into redshift ranges. The solid lines represent the MS from Popesso et al. (2023) evaluated at the mean redshift of each subsample, denoted by the points, using the same colour as the MS. The shaded areas and dashed lines represent 0.09 dex of scatter obtained by Popesso et al. (2023). The horizontal dashed lines designate the minimum detectable SFR for each redshift bin and SFR tracer, using the same colour scheme. The inset histograms show the redshift distribution for the complete sample in each panel. The vertical thick black dashed line indicates the redshift mean, and the vertical thin lines indicate the sample division boundaries. The numbers at the top indicate the total number of objects in each panel.
Current usage metrics show cumulative count of Article Views (full-text article views including HTML views, PDF and ePub downloads, according to the available data) and Abstracts Views on Vision4Press platform.
Data correspond to usage on the plateform after 2015. The current usage metrics is available 48-96 hours after online publication and is updated daily on week days.
Initial download of the metrics may take a while.