Fig. 5
Download original image
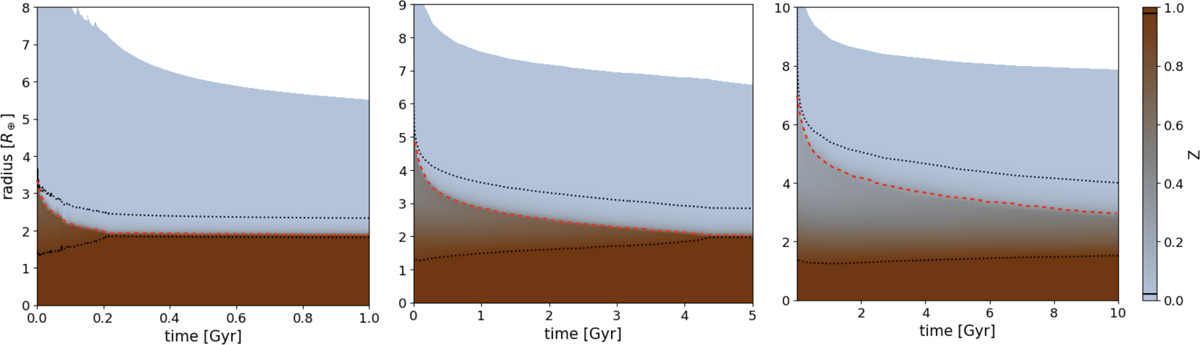
Silicate mass fraction (color) distribution in radius (y-axis) and time (x-axis). The evolution is shown for 5 M⊕ (left), 10 M⊕ (middle), and 20 M⊕ (right). The x-axis has different ranges (1 Gyr, 5 Gyr, and 10 Gyr). The dotted black curves indicate Z = 0.98 and Z = 0.02 silicate mass fraction levels. The dashed red curve signifies the boundary between saturated and undersaturated regions, according to Eq. (9). A core-envelope boundary is approximately indicated by the Z = 0.98 curve. Because of the high temperatures at the core-envelope boundary, the (saturated) envelope is characterized by a silicate mass fraction of a few percent.
Current usage metrics show cumulative count of Article Views (full-text article views including HTML views, PDF and ePub downloads, according to the available data) and Abstracts Views on Vision4Press platform.
Data correspond to usage on the plateform after 2015. The current usage metrics is available 48-96 hours after online publication and is updated daily on week days.
Initial download of the metrics may take a while.