Fig. 4
Download original image
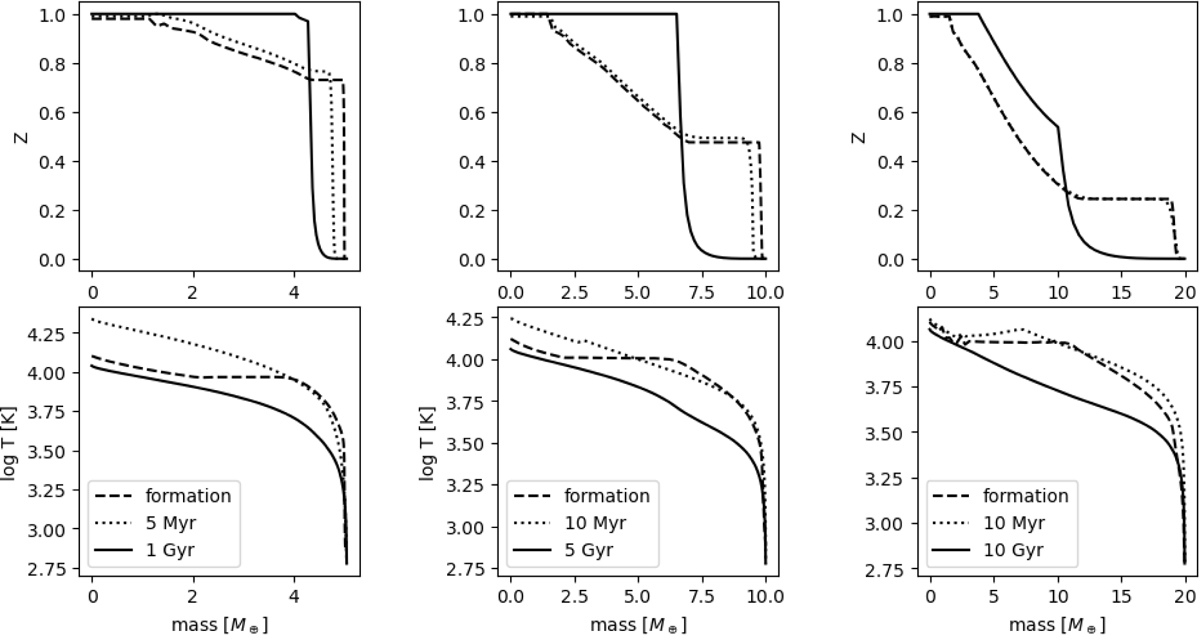
Interior silicate mass fraction (top) and temperature profile (bottom) of 5 M⊕ (left), 10 M⊕ (middle) and 20 M⊕ (right) planets. The profiles are shown at the end of formation (dashed), after the rapid contraction (dotted), and after 1, 5, 10 Gyr (solid) for an evolution at 0.2 AU. The early contraction (from a Hill sphere to about one-tenth of it) is the cause of the gas temperature increase between the formation and the million-year curves. The increase in the central temperatures is the result of core contraction due to the constant core density assumption in the formation model. The dashed and dotted lines of the 20 M⊕ model overlap in the top right panel.
Current usage metrics show cumulative count of Article Views (full-text article views including HTML views, PDF and ePub downloads, according to the available data) and Abstracts Views on Vision4Press platform.
Data correspond to usage on the plateform after 2015. The current usage metrics is available 48-96 hours after online publication and is updated daily on week days.
Initial download of the metrics may take a while.