Fig. 10.
Download original image
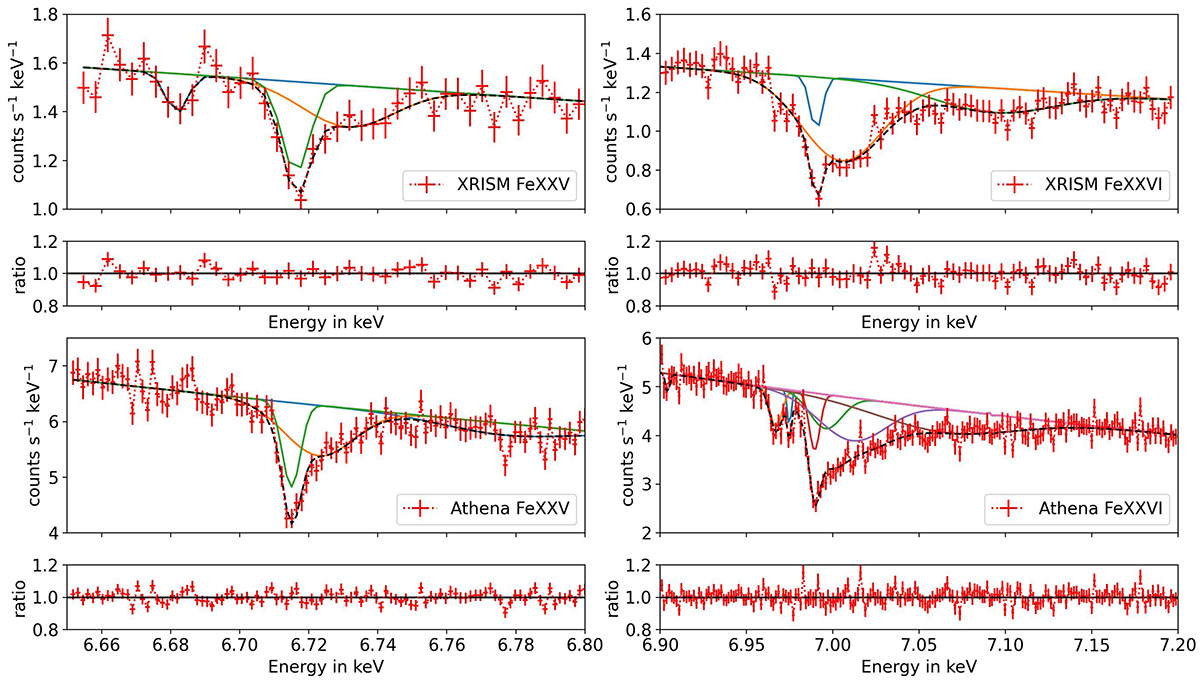
Fitting the Fe XXV (left) and Fe XXVI (right) absorption line in the fake-spectra (red, plus symbols) of XRISM (top) and Athena (bottom) with multiple Gaussians components. The fake-spectra correspond to 100 ks observations along i = 21° through the MHD model with μ = 0.0010. Each fit also shows the constituent Gaussian components. The total model is shown in black dashed line. The higher photon counts indicates Athena’s higher effective area. The shape of the line profile is captured more accurately by Athena because of higher energy resolution. The ratio of data/model is shown at the bottom of each fit.
Current usage metrics show cumulative count of Article Views (full-text article views including HTML views, PDF and ePub downloads, according to the available data) and Abstracts Views on Vision4Press platform.
Data correspond to usage on the plateform after 2015. The current usage metrics is available 48-96 hours after online publication and is updated daily on week days.
Initial download of the metrics may take a while.