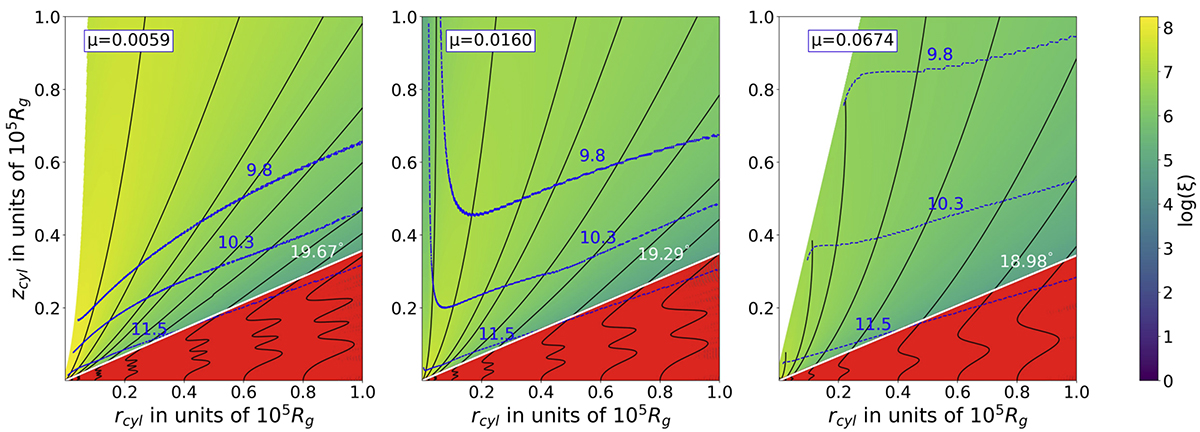
Fig. 1.
Download original image
Variation of ξ in the r − z plane for different magnetisations, μ = 0.0059, 0.0160, 0.0674 (from left to right). The Compton-thick region with Nh > 1024.18 along the LOS is shown in red. The white line shows the lowest possible Compton-thin LOS and the value of corresponding i value is given next to it. Black solid lines spread over the whole region are the poloidal magnetic field lines anchored at different radii. Density contours are shown in blue dashed lines. The corresponding log of density (in cc) is written just next to each density iso-contour.
Current usage metrics show cumulative count of Article Views (full-text article views including HTML views, PDF and ePub downloads, according to the available data) and Abstracts Views on Vision4Press platform.
Data correspond to usage on the plateform after 2015. The current usage metrics is available 48-96 hours after online publication and is updated daily on week days.
Initial download of the metrics may take a while.