Fig. 4
Download original image
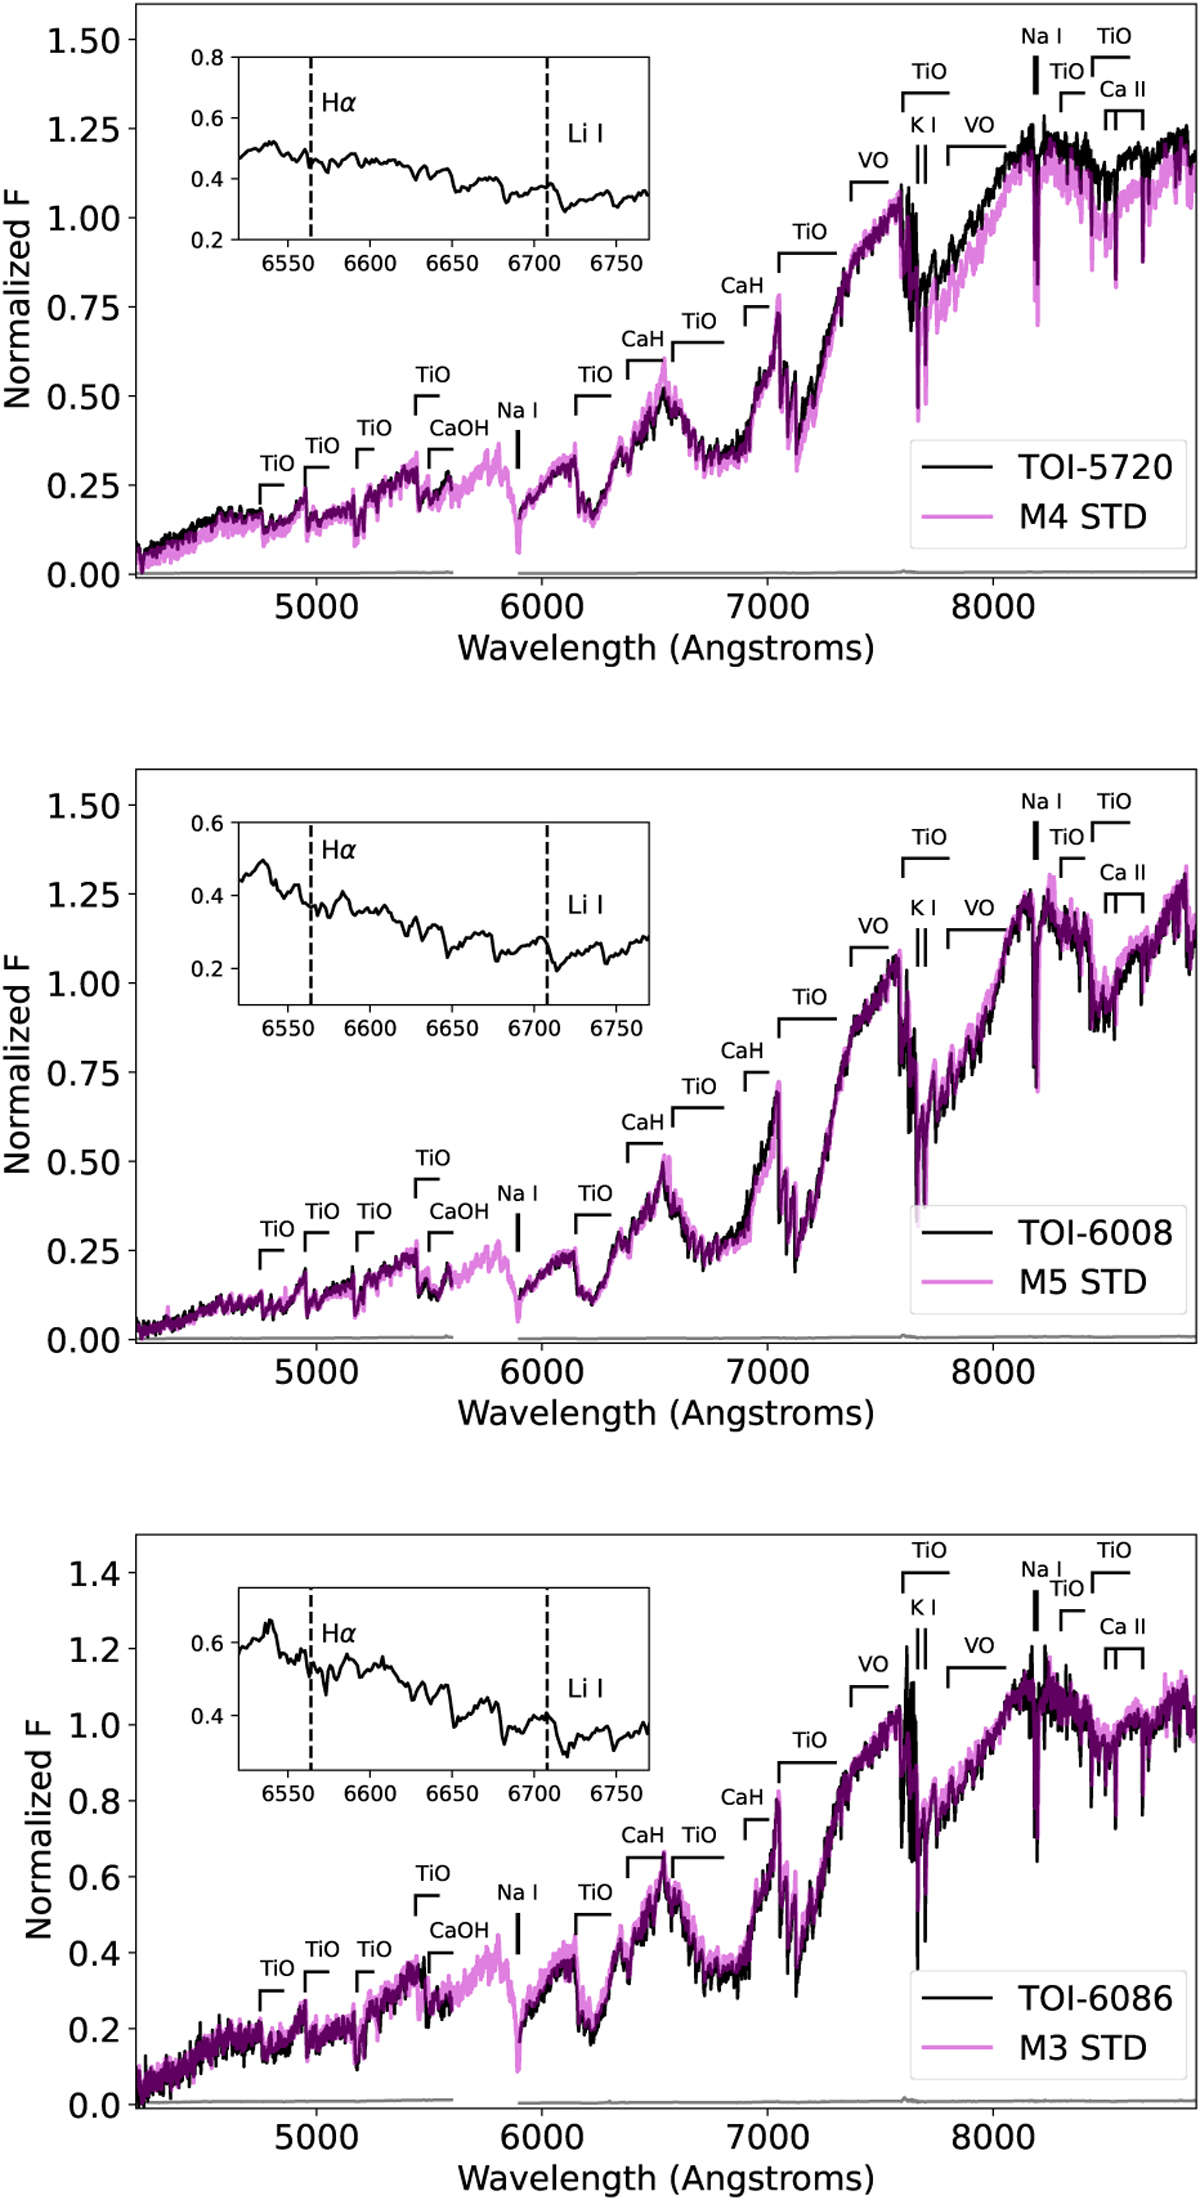
Shane/Kast blue and red optical spectra of TOI-5720 (top), TOI-6008 (middle), and TOI-6086 (bottom). The target spectra (black lines) are normalized at 7400 Å and compared to their best-fit SDSS standard template (magenta lines) from Bochanski et al. (2007). The gaps in the target spectra between 5600 and 5900 Å correspond to the dichroic split between the Kast blue and red channels. Key spectral features in the 4200–8900 Å region are labeled. The inset box highlights the region around the 6563 Å Hα and 6708 Å Li I lines, neither of which are detected in any of the sources.
Current usage metrics show cumulative count of Article Views (full-text article views including HTML views, PDF and ePub downloads, according to the available data) and Abstracts Views on Vision4Press platform.
Data correspond to usage on the plateform after 2015. The current usage metrics is available 48-96 hours after online publication and is updated daily on week days.
Initial download of the metrics may take a while.