Fig. 2
Download original image
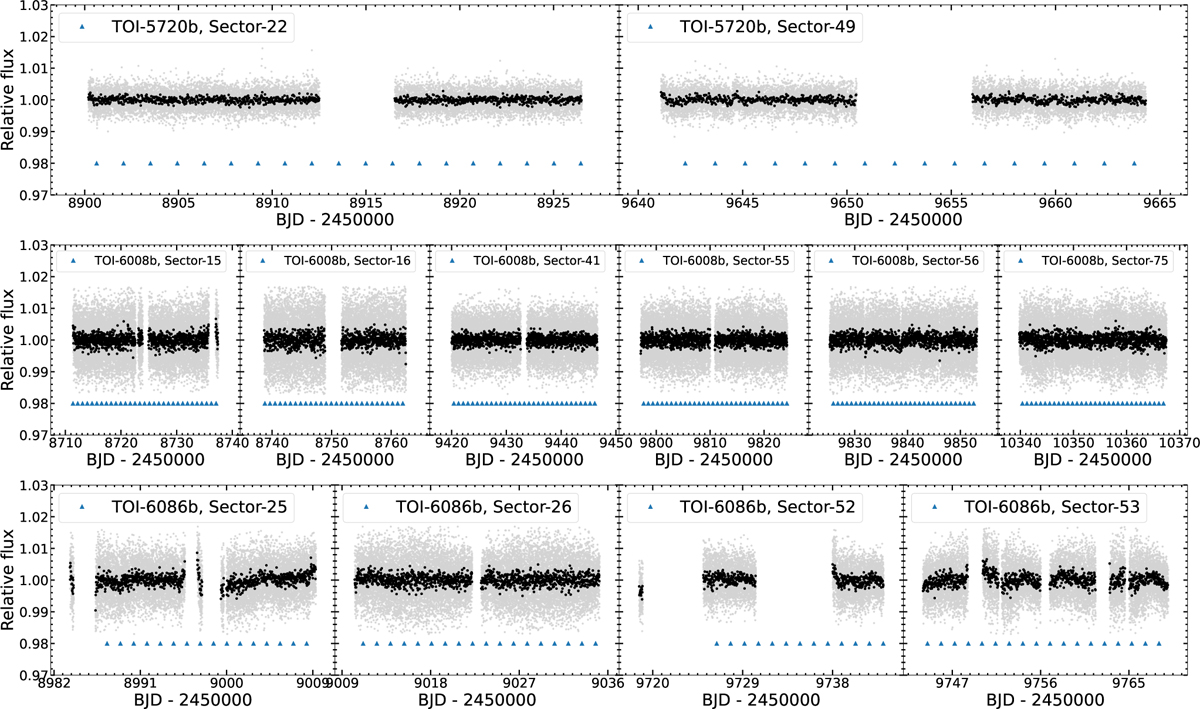
TESS PDC-SAP flux extracted from the 2-minute cadence data of TOI-5720 (top panel), TOI-6008 (middle panel), and TOI-6086 (bottom panel). TOI-5720 was observed in sectors 22 and 49, TOI-6008 was observed in sectors 15, 16, 41, 55, 56 and 75, and TOI-6086 was observed in sectors 25, 26, 52 and 53. The light grey points show the 2-minute cadence data, and the black points shows the flux in 30-minutes bins. The transit locations of TOI-5720 b, TOI-6008 b, and TOI-6086 b are shown with the blue triangles.
Current usage metrics show cumulative count of Article Views (full-text article views including HTML views, PDF and ePub downloads, according to the available data) and Abstracts Views on Vision4Press platform.
Data correspond to usage on the plateform after 2015. The current usage metrics is available 48-96 hours after online publication and is updated daily on week days.
Initial download of the metrics may take a while.