Fig. 11
Download original image
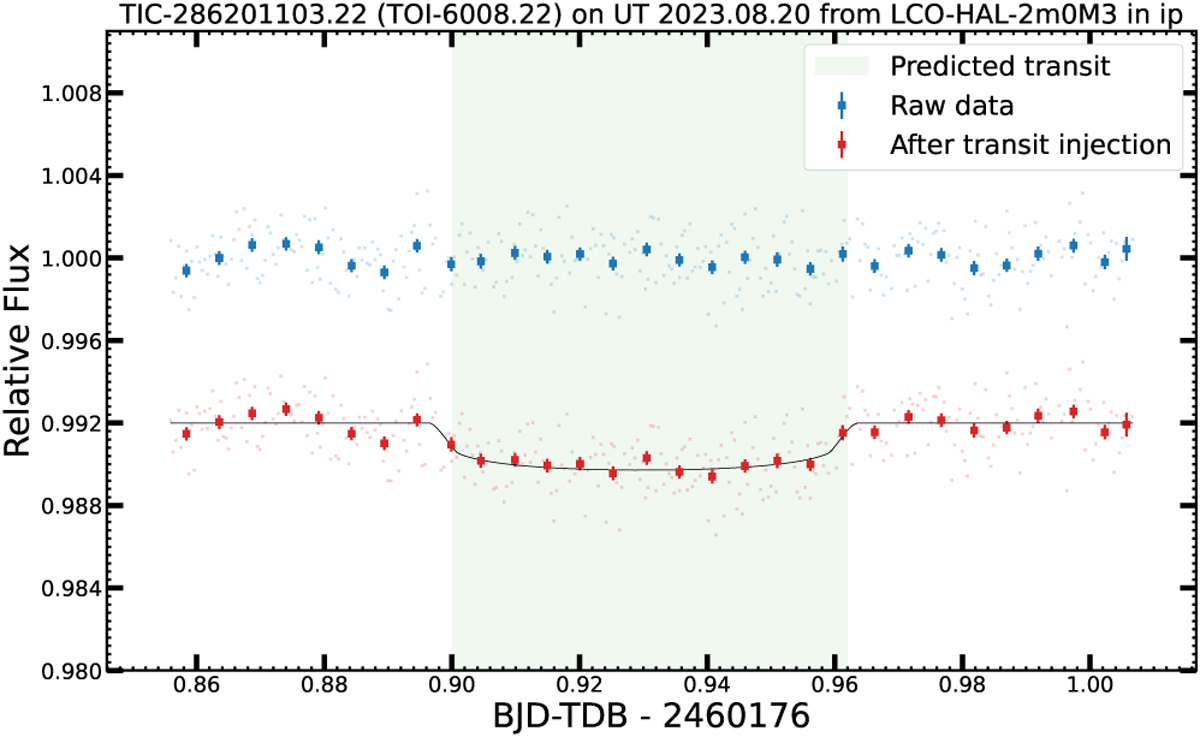
LCO-HAL-2 m0/MuSCAT photometry of TOI-6008.22 collected on UT August 20, 2023 in the Sloan-i′ filter with an exposure time of 30s. The blue data points show the raw light curve. The red data points show the light curve after the transit injection of an Earth-sized planet of ~1.12 R⊕ with the best-fitting model superimposed in black. The green region shows the predicted ingress and egress of the transit. The light curves are shifted along the y-axis for clarity.
Current usage metrics show cumulative count of Article Views (full-text article views including HTML views, PDF and ePub downloads, according to the available data) and Abstracts Views on Vision4Press platform.
Data correspond to usage on the plateform after 2015. The current usage metrics is available 48-96 hours after online publication and is updated daily on week days.
Initial download of the metrics may take a while.