Fig. A.2
Download original image
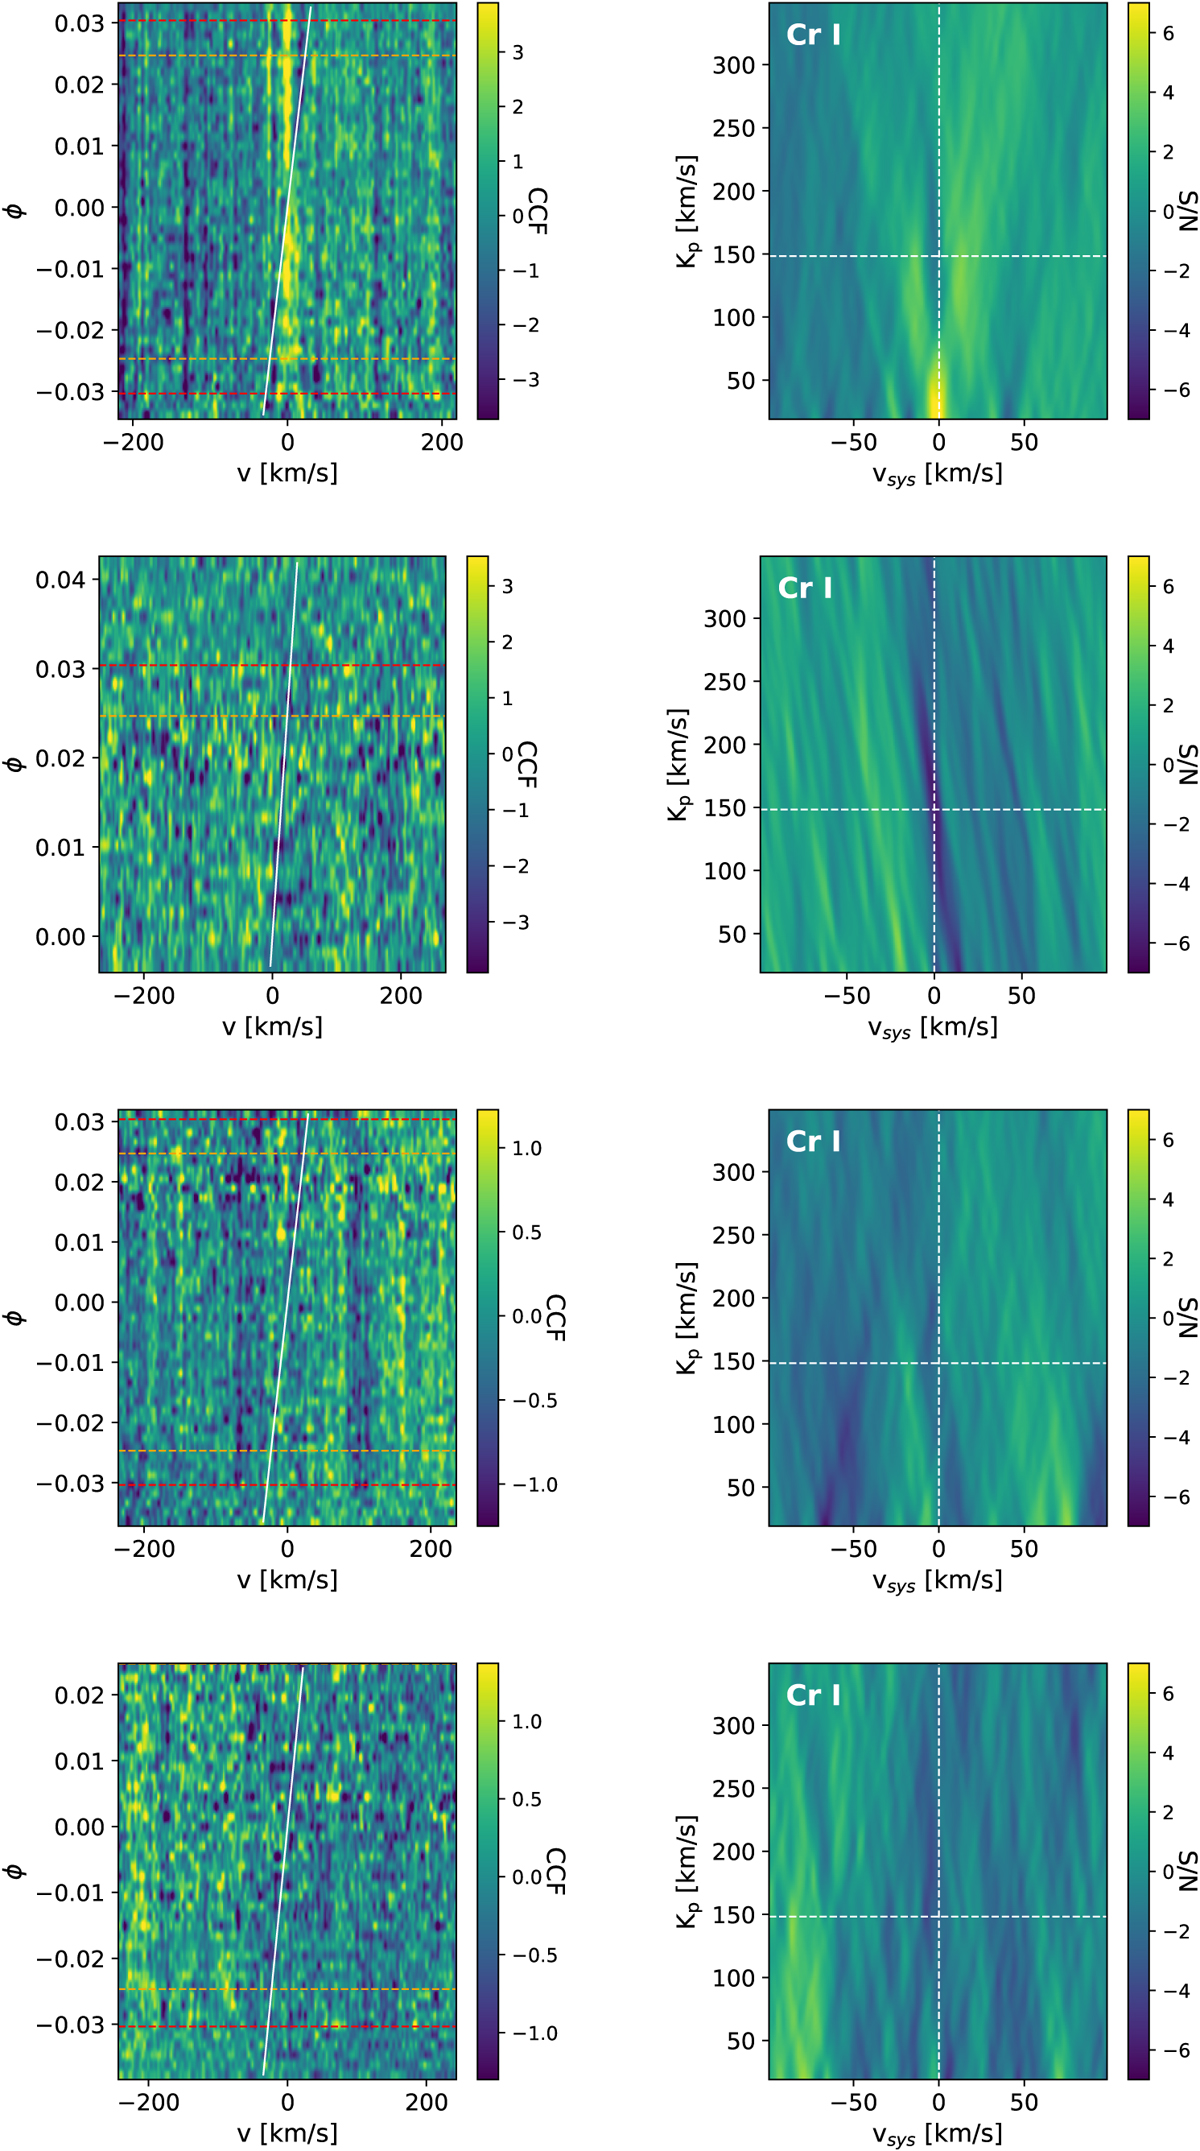
Cross-correlation signatures of Cr I. Left column–Phase stack of the cross-correlation between the transmission spectra and the Cr I mask. The nights N1, N2, N3, and N4 are shown from top to bottom, respectively. In each plot, the orange dashed lines mark the orbital phases corresponding to the second and third contacts. Similarly, the red dashed lines mark the first and fourth contacts. The white solid line traces the expected planetary signal. Right column–Kp−υsys planes corresponding to the CCFs shown in the left column. In each plot, the dashed cross marks the expected Kp and υsys of the system.
Current usage metrics show cumulative count of Article Views (full-text article views including HTML views, PDF and ePub downloads, according to the available data) and Abstracts Views on Vision4Press platform.
Data correspond to usage on the plateform after 2015. The current usage metrics is available 48-96 hours after online publication and is updated daily on week days.
Initial download of the metrics may take a while.