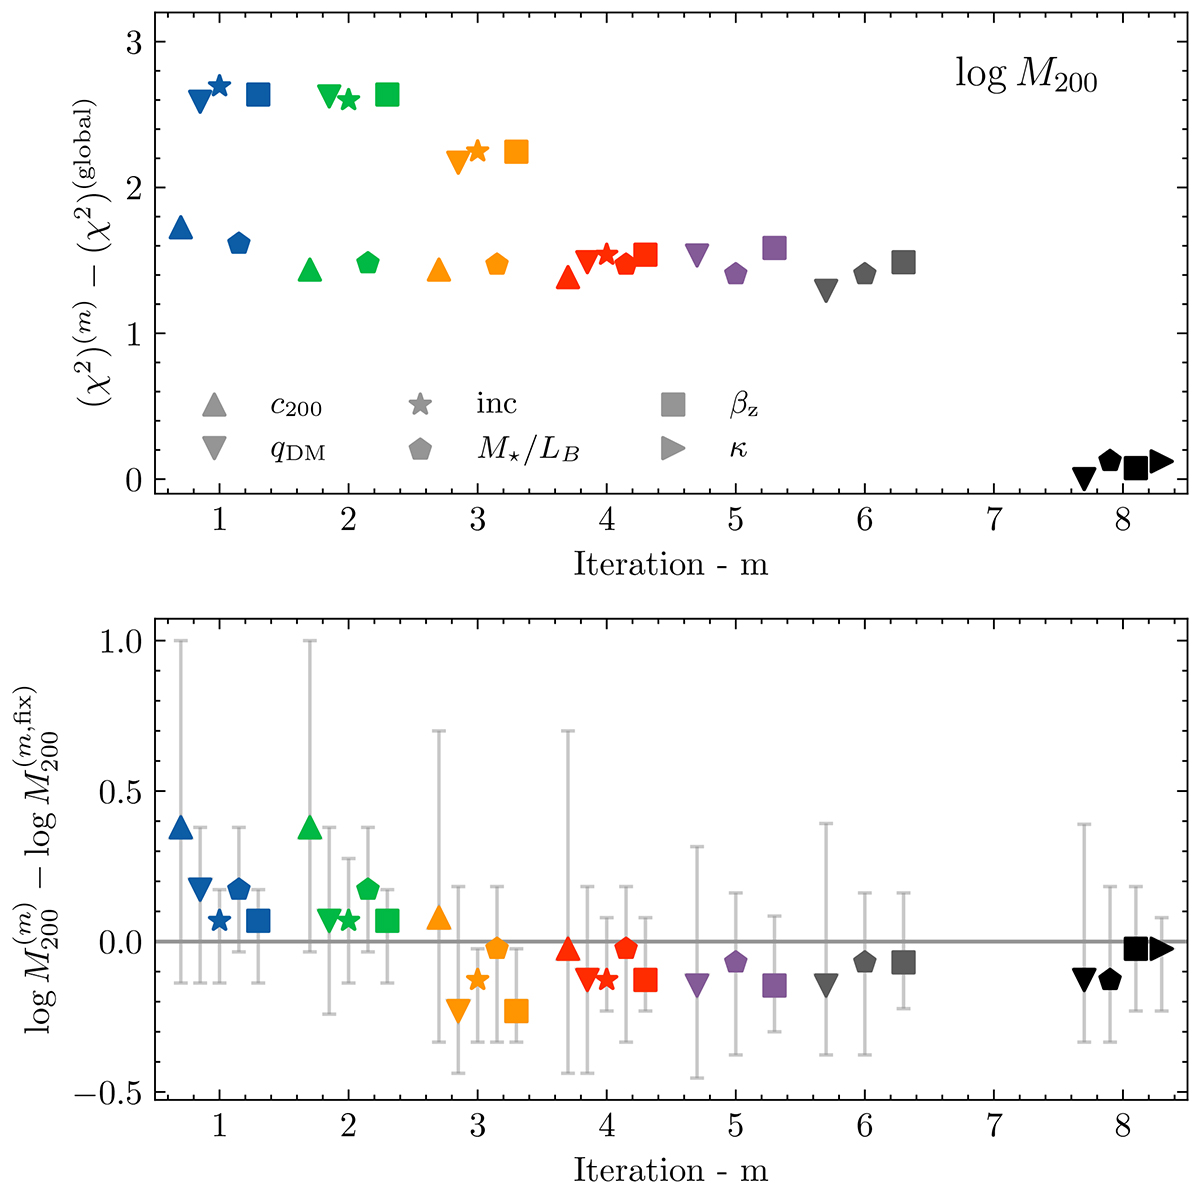
Fig. 8.
Download original image
Evolution of the minimal χ2 and associated values of the parameter at the minimum, when different parameters were covarying for log M200. Each colour highlights the iteration step and the symbols correspond to the different parameters covarying in the 2D grid. In iteration 7, log M200 was kept constant as seen in Table 5. The top panel shows the evolution of the minimal χ2 value for the individual 2D covariation compared with the global minimum of χ2 for all grids and iterations. The bottom panel shows the difference between the value of the parameter at the minimum with 1σ uncertainties and the value of the parameter shown in Table 5 at a given iteration. The grey horizontal line is shown as a guide.
Current usage metrics show cumulative count of Article Views (full-text article views including HTML views, PDF and ePub downloads, according to the available data) and Abstracts Views on Vision4Press platform.
Data correspond to usage on the plateform after 2015. The current usage metrics is available 48-96 hours after online publication and is updated daily on week days.
Initial download of the metrics may take a while.