Fig. 6.
Download original image
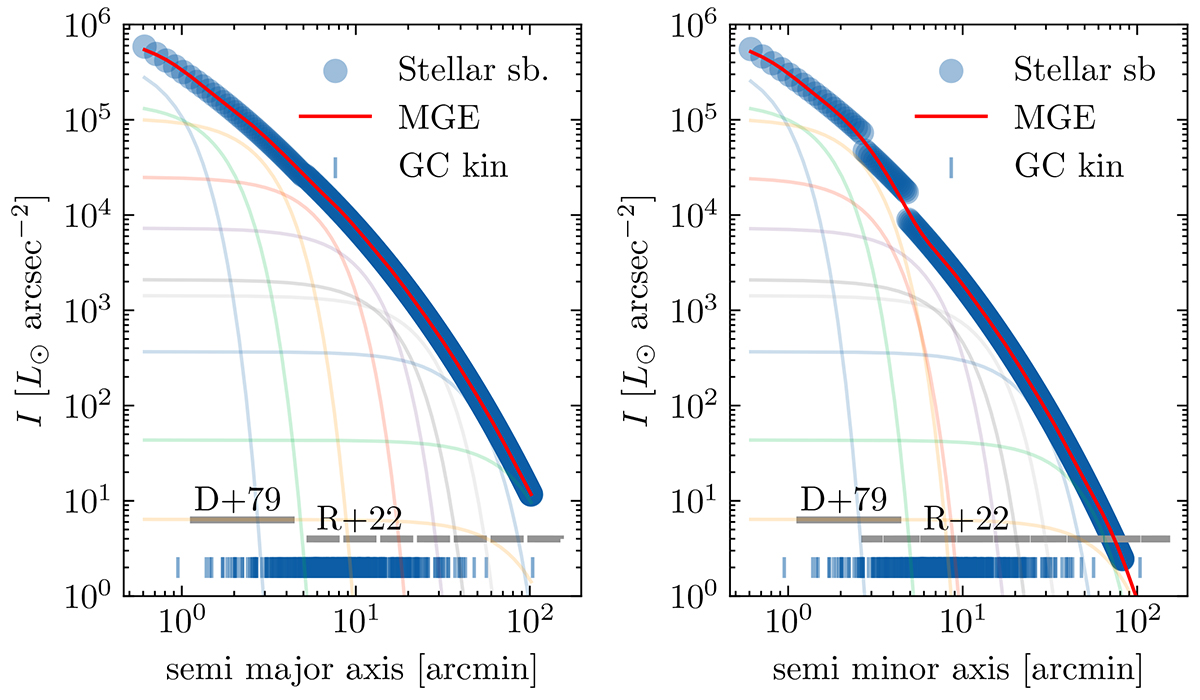
Combined stellar surface brightness profile of Cen A from Dufour et al. (1979) and Rejkuba et al. (2022) and its MGE decomposition. The left panel shows the profile along the semimajor axis and the right along the semiminor axis. The blue points show the observed 2D profile we generated with Eq. (6) in the region highlighted by the grey solid line (D+79 fitting region) and Eq. (8) in the outer regions highlighted with the grey dashed line (R+22 fitting region). The red line shows the resulting MGE fit to the profile and the faint coloured lines are the individual Gaussian components. The blue vertical bars at the bottom of the figure show the positions of the kinematic tracers.
Current usage metrics show cumulative count of Article Views (full-text article views including HTML views, PDF and ePub downloads, according to the available data) and Abstracts Views on Vision4Press platform.
Data correspond to usage on the plateform after 2015. The current usage metrics is available 48-96 hours after online publication and is updated daily on week days.
Initial download of the metrics may take a while.