Fig. 5.
Download original image
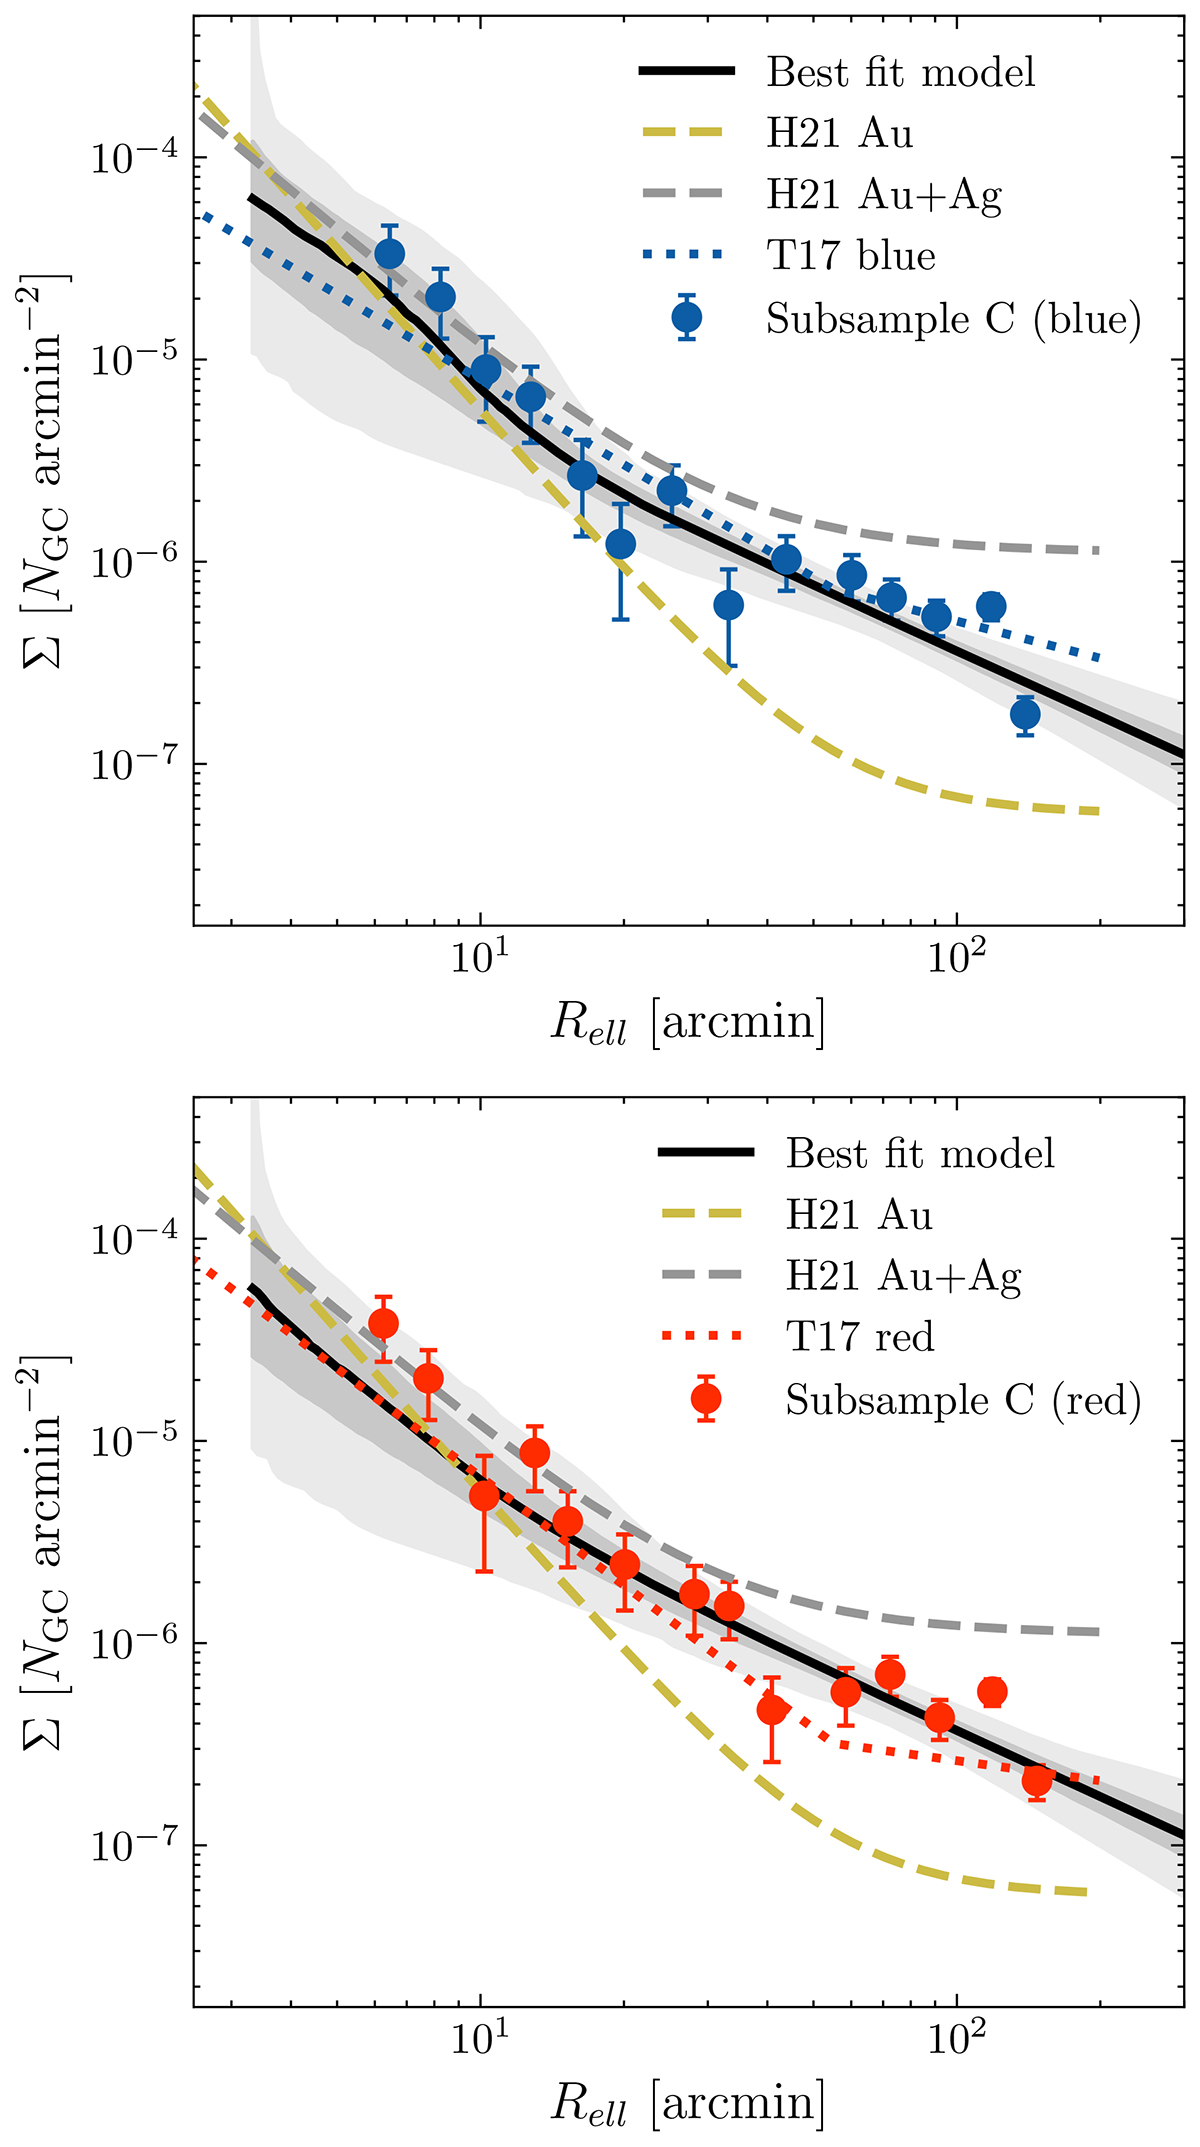
Tracer density distribution for subsample C of GCs. The top figure shows the blue and the bottom the red population. The blue and red points with associated uncertainties indicate the binned profile computed for the respective subpopulation GCs. A solid black line shows the best-fit model to the data, and dark and light grey shadings show 1 and 3σ uncertainties computed as the 16th and 99.7th percentiles from the posterior. The dotted blue and red lines show the best-fit double power-law from T17 for each population. H21 used different datasets to determine three different stages of the clean photometric datasets. They refer to the best sample as golden (Au) and the next best sample as the silver (Ag) sample. The dashed yellow line shows the best-fit model of the golden sample from H21 and the dashed grey line the silver and golden combined. The two literature results are arbitrarily scaled for comparison.
Current usage metrics show cumulative count of Article Views (full-text article views including HTML views, PDF and ePub downloads, according to the available data) and Abstracts Views on Vision4Press platform.
Data correspond to usage on the plateform after 2015. The current usage metrics is available 48-96 hours after online publication and is updated daily on week days.
Initial download of the metrics may take a while.