Fig. 2.
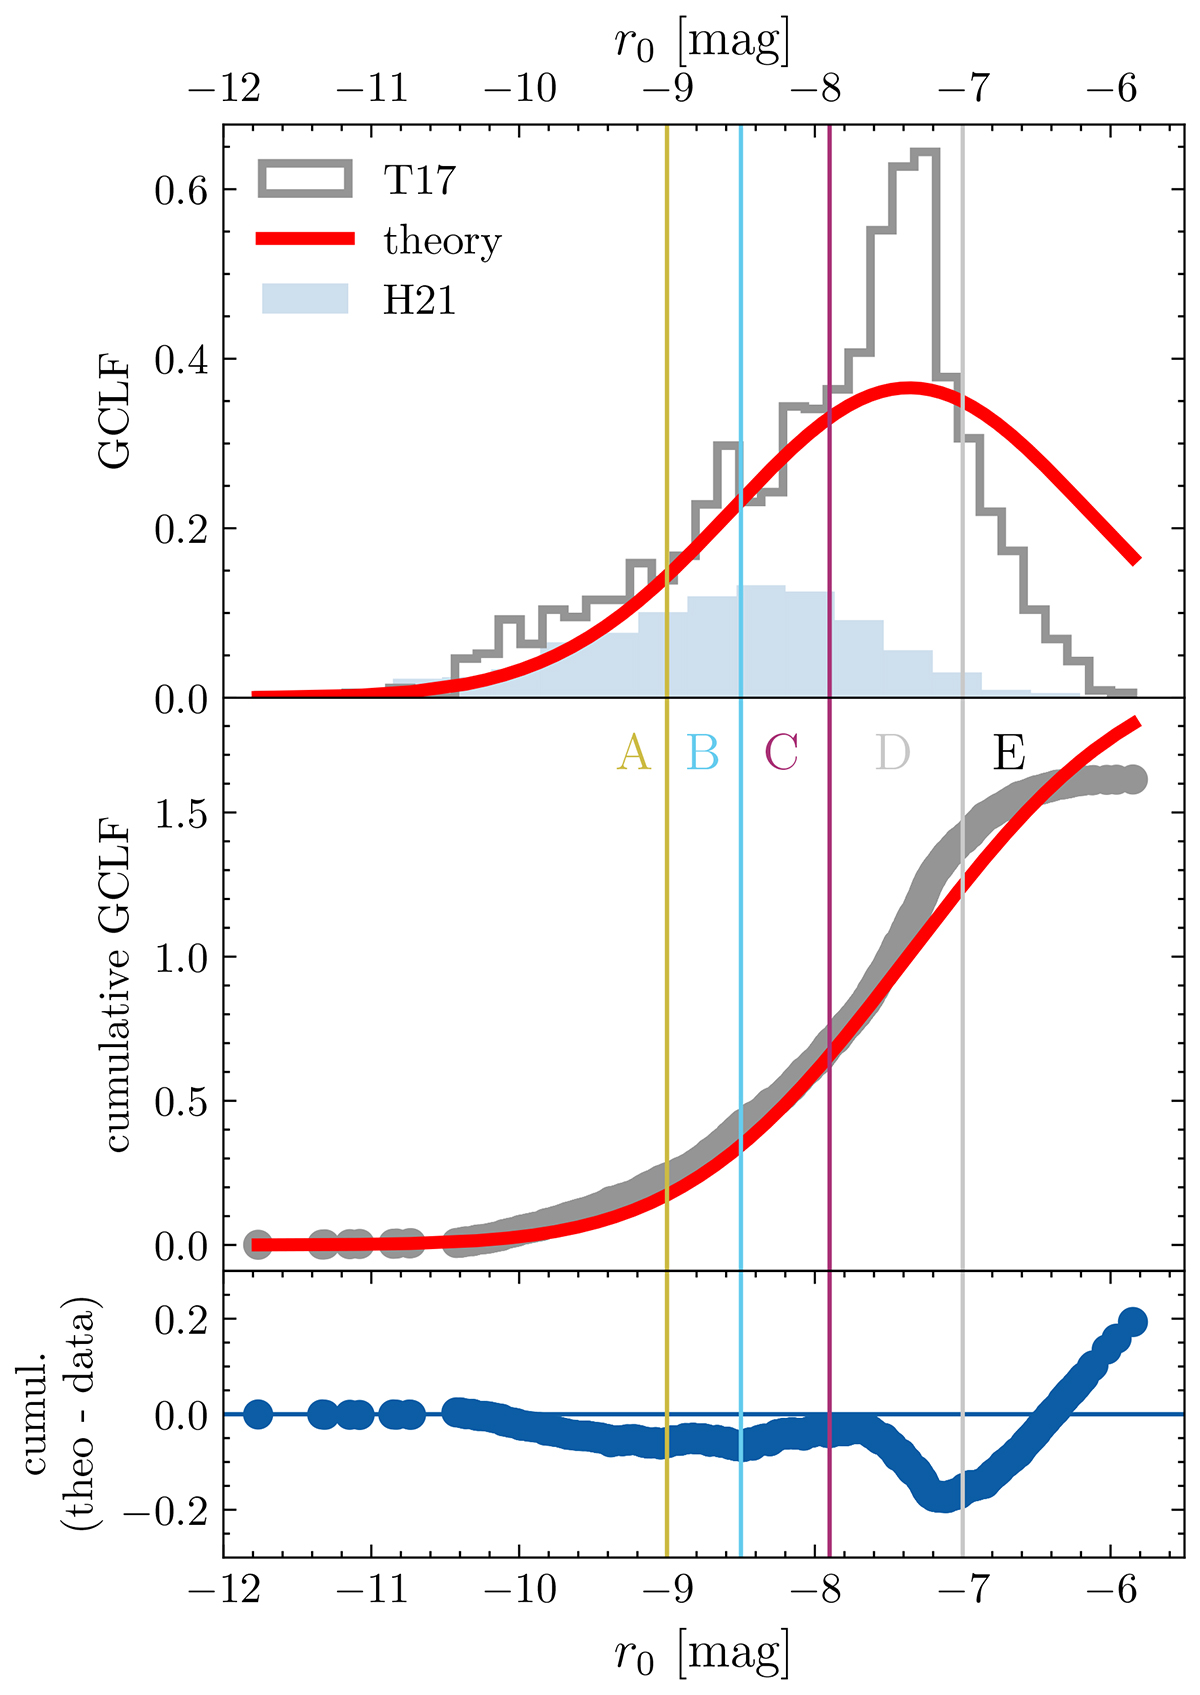
Download original image
Comparison between the observed GCLF from the T17 candidate GCs in grey and theoretical GCLF in red. The top panel shows the GCLF and the middle panel the cumulative GCLF, which allows a more precise determination of the magnitude subsamples. Both theoretical GCLFs are scaled, to match the total observed number of GCs in regions A–C. The bottom panel is based on the cumulative GCLF from the middle panel and it shows the difference between the theoretical and observed distributions. The coloured vertical lines delineate different magnitude subsamples labelled with A–E in corresponding colours. The light blue histogram on the top panel shows the magnitude distribution of the kinematic H21 dataset and is arbitrarily scaled for clarity.
Current usage metrics show cumulative count of Article Views (full-text article views including HTML views, PDF and ePub downloads, according to the available data) and Abstracts Views on Vision4Press platform.
Data correspond to usage on the plateform after 2015. The current usage metrics is available 48-96 hours after online publication and is updated daily on week days.
Initial download of the metrics may take a while.