Fig. 12.
Download original image
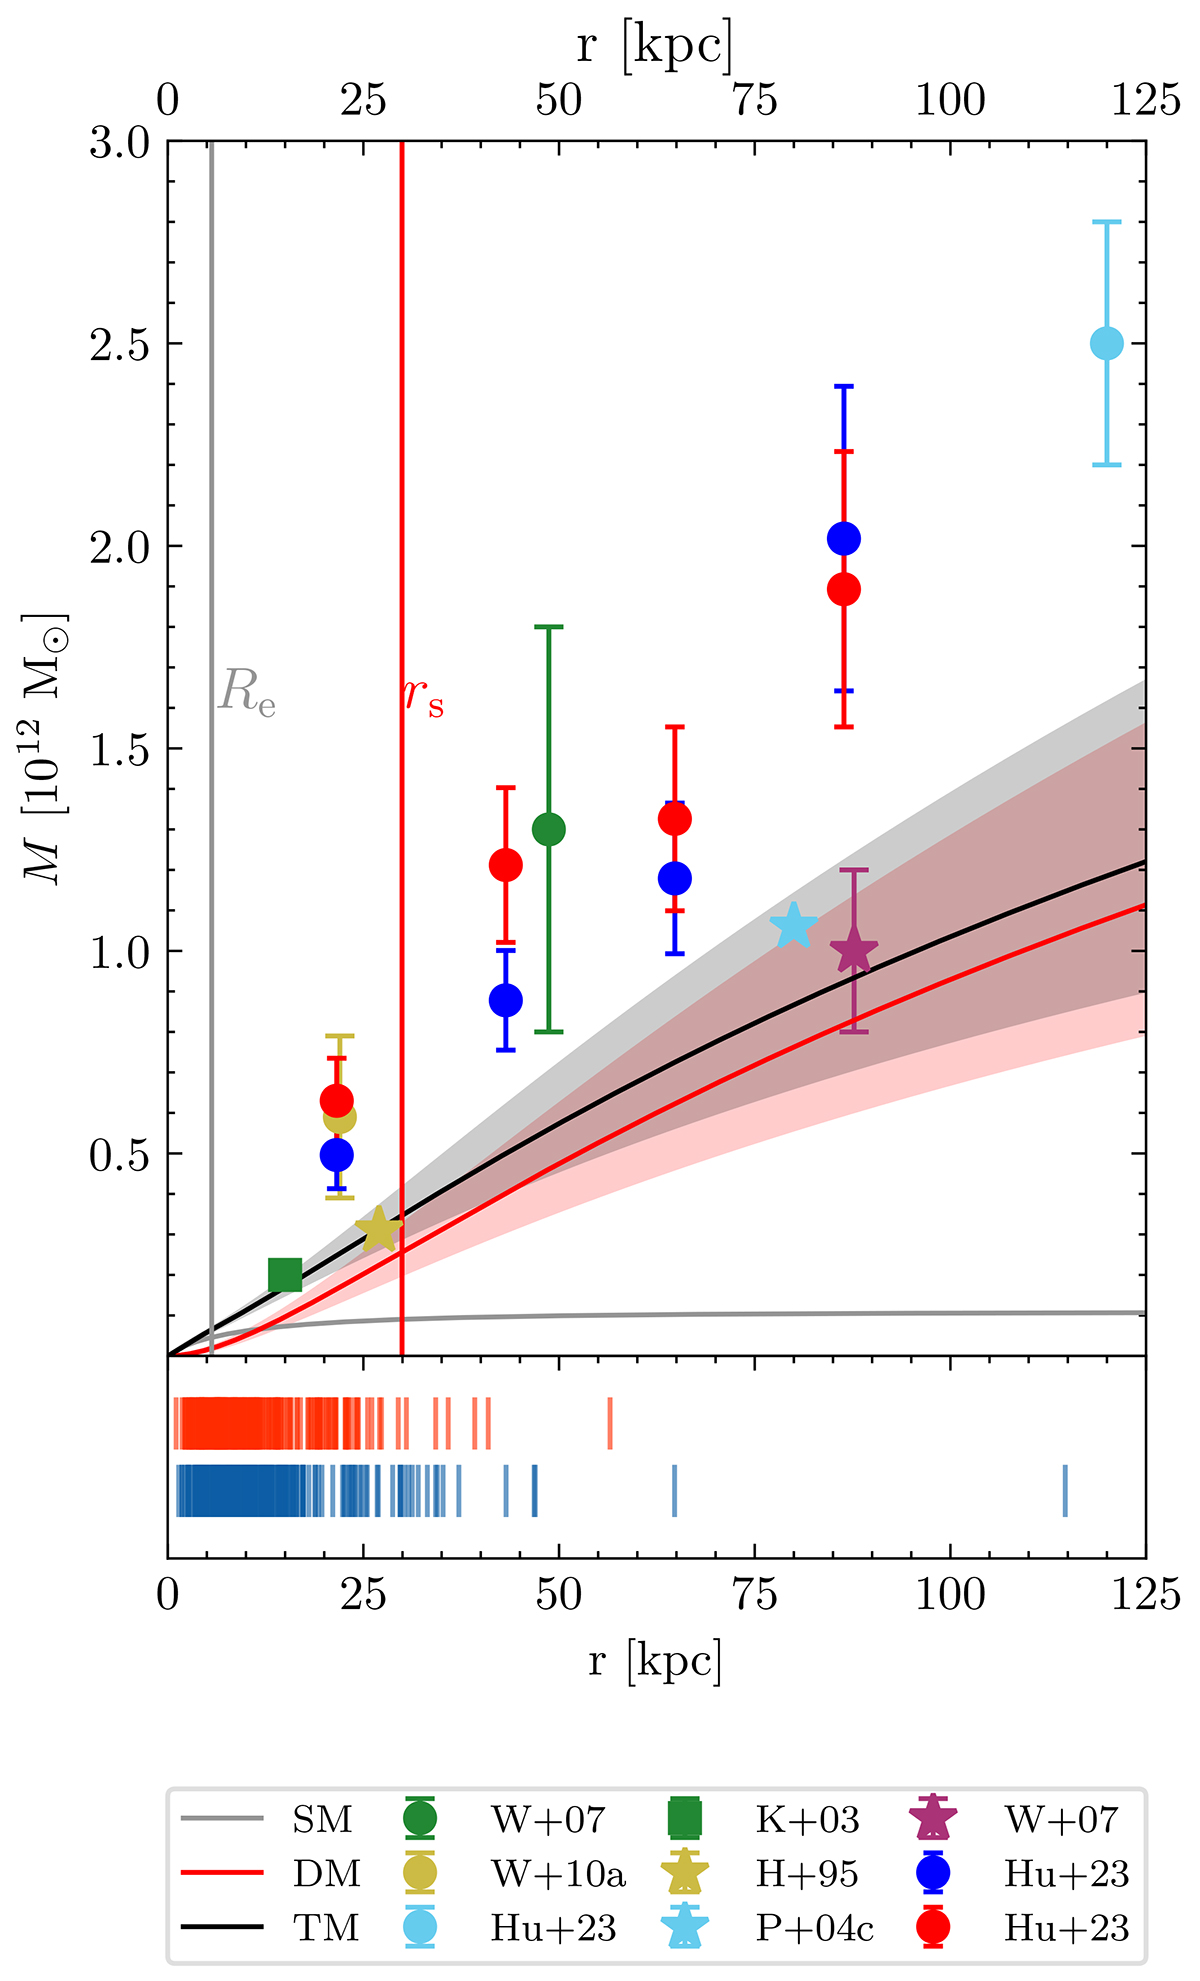
Enclosed mass measurements from this work and literature studies. Measurements from this work are shown with lines and literature studies with symbols. The grey line shows the stellar enclosed mass, with M⋆/LB determined in this work. The red line with the associated shaded 1σ uncertainty region shows the enclosed dark matter mass integrated in spherical shells with rs the scale radius of an NFW halo. The black line shows the total mass. Circles show literature measurements of the total mass with GCs as dynamical tracers, stars show PN-based measurements, and the square shows measurements from X-ray gas from Kraft et al. (2003). The green point shows the measurement with the whole sample of GCs from Woodley et al. (2007), the yellow point shows the most robust measurement from Woodley et al. (2010a), and the light blue point shows the measurement from Hughes et al. (2023). Blue and red circles show the enclosed mass estimates from blue and red GCs respectively from Hughes et al. (2023). The stars show constraints from PNe, with yellow showing estimate from Hui et al. (1995), light blue from Peng et al. (2004a), with correction from Woodley et al. (2007), and the measurement from the latter study is shown in purple. The location of the red and blue GCs used in this work is shown in the bottom panel.
Current usage metrics show cumulative count of Article Views (full-text article views including HTML views, PDF and ePub downloads, according to the available data) and Abstracts Views on Vision4Press platform.
Data correspond to usage on the plateform after 2015. The current usage metrics is available 48-96 hours after online publication and is updated daily on week days.
Initial download of the metrics may take a while.