Fig. 10.
Download original image
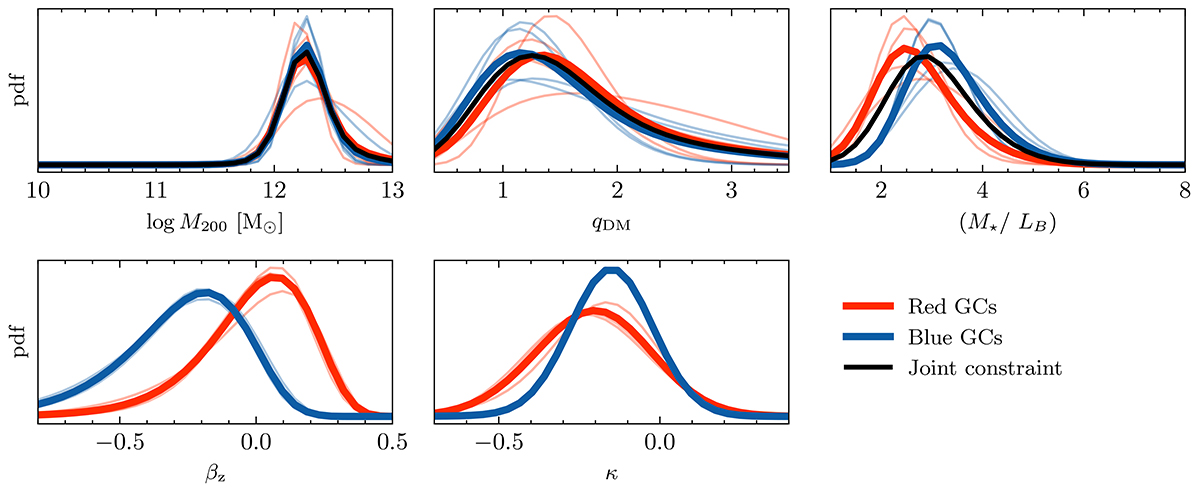
Posterior distributions of the individual parameters for the final iteration. Red and blue coloured lines correspond to the constraints from the corresponding GC subpopulation and black shows the joint posterior. Thin lines are the marginalised posteriors from the different parameter pairs shown in Fig. 9 and the thick lines are the joint probabilities from all of the parameter pairs. The parameters in the bottom row are intrinsic to the two GC populations and we do not combine them.
Current usage metrics show cumulative count of Article Views (full-text article views including HTML views, PDF and ePub downloads, according to the available data) and Abstracts Views on Vision4Press platform.
Data correspond to usage on the plateform after 2015. The current usage metrics is available 48-96 hours after online publication and is updated daily on week days.
Initial download of the metrics may take a while.