Fig. 1.
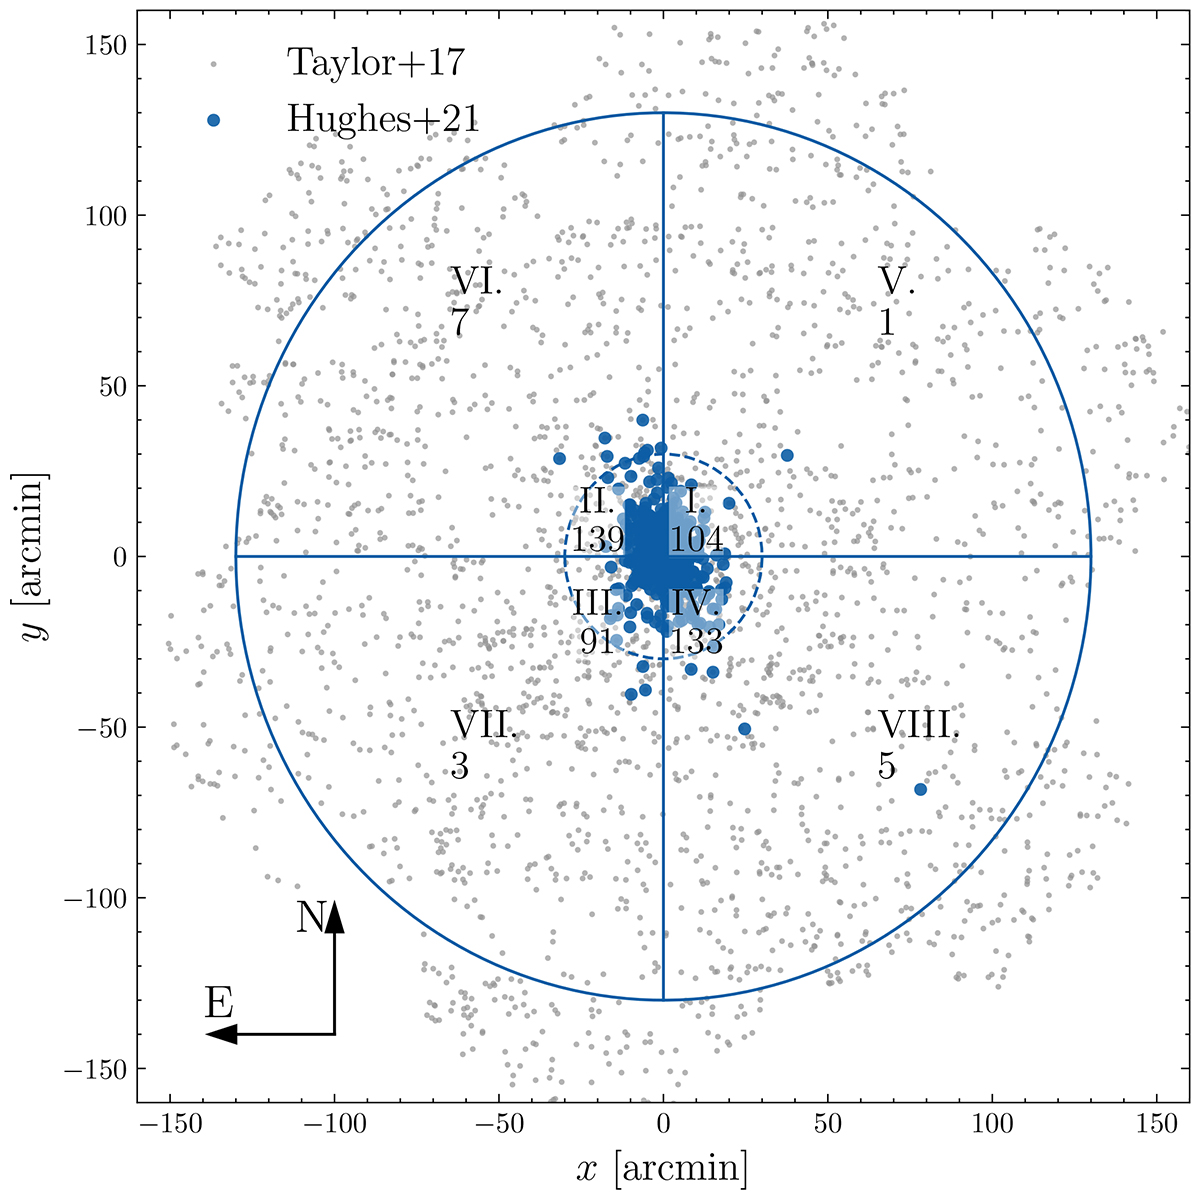
Download original image
Spatial distribution of the photometric GC candidates from T17 in small grey points and of the kinematic dataset from H21 shown with larger blue dots. The dashed and solid blue circles mark the radius of 30 arcmin and 130 arcmin respectively. The blue lines delimit the quadrants used in Sect. 3.1 to determine the magnitude-selected subsample of GC candidates from T17 that are consistent with a relaxed axisymmetric distribution. The Roman numerals indicate the number of the respective quadrant and the Arabic numbers below the number of GCs with kinematic measurements in the corresponding quadrant.
Current usage metrics show cumulative count of Article Views (full-text article views including HTML views, PDF and ePub downloads, according to the available data) and Abstracts Views on Vision4Press platform.
Data correspond to usage on the plateform after 2015. The current usage metrics is available 48-96 hours after online publication and is updated daily on week days.
Initial download of the metrics may take a while.