Fig. 8
Download original image
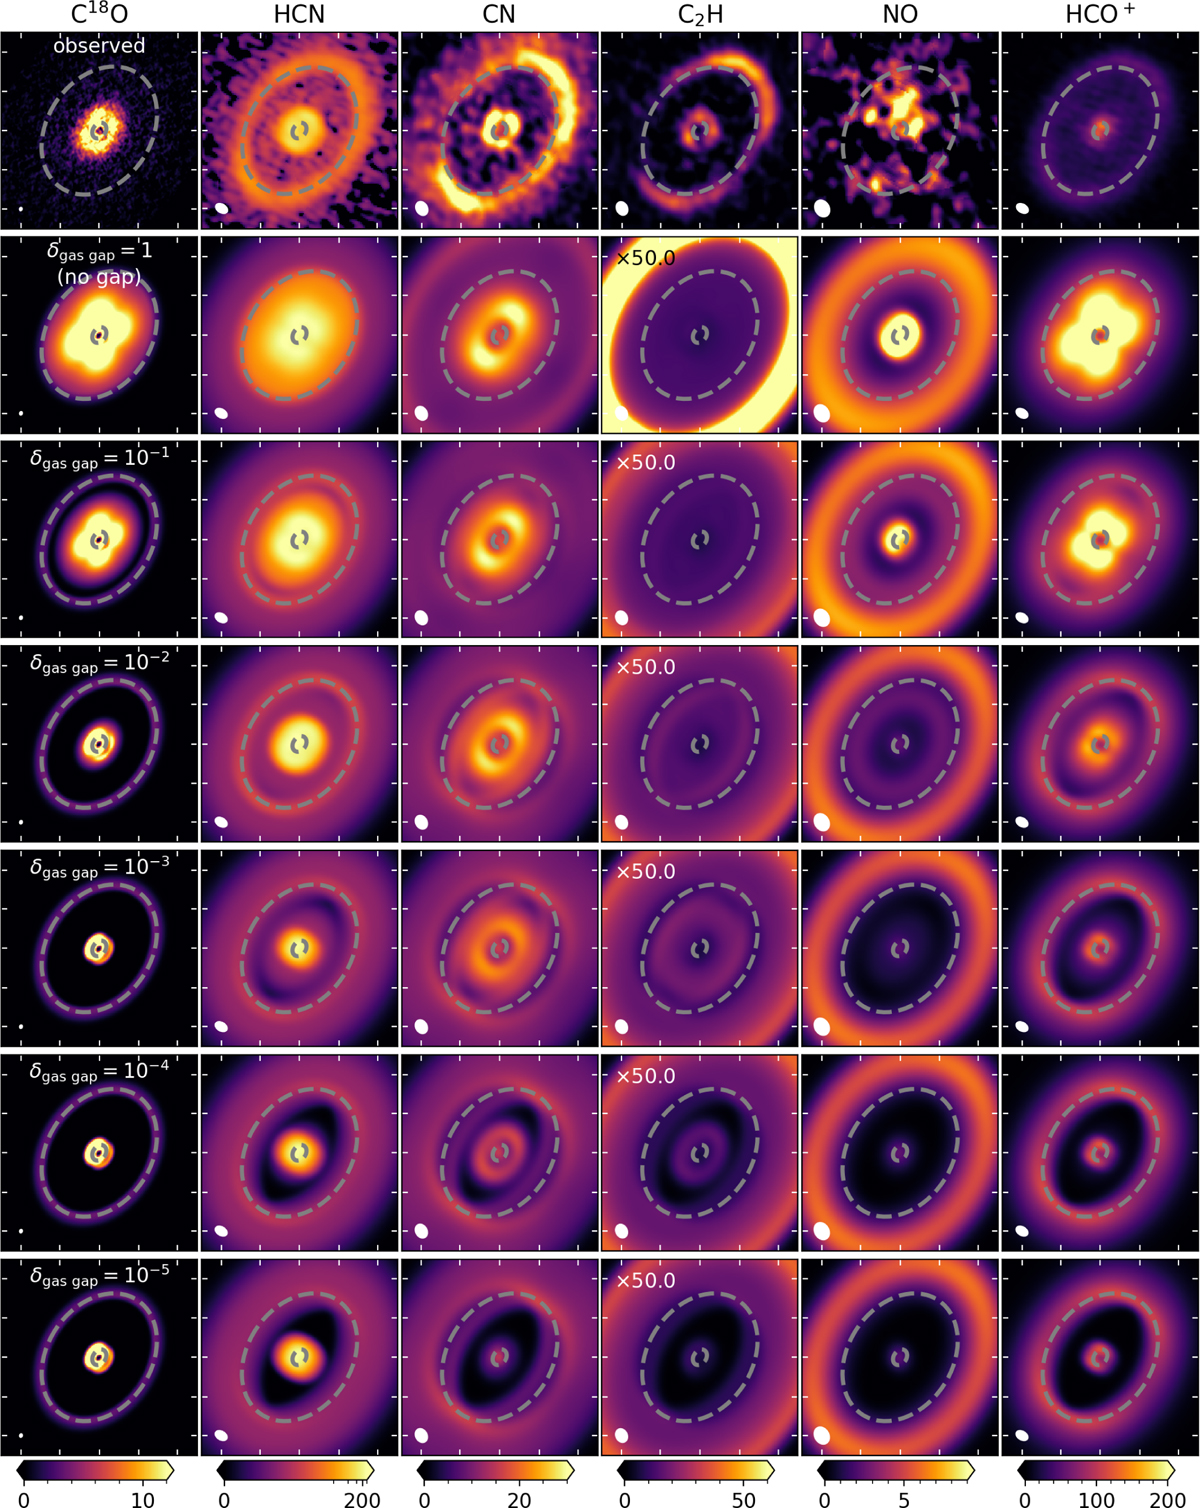
Integrated intensity (moment 0) maps in mJy km s−1 beam−1 for C18O, HCN, CN, C2H, NO, and HCO+ from left to right. The different rows present the results for different depth of the gas gap with the gap depth (δgas gap) indicated in the top of the left column. The HCN emission is shown on a logarithmic scale to highlight the weak outer ring. The beam is indicated in the bottom left corner of each panel and the tickmarks on the axes are spaced 1″ apart.
Current usage metrics show cumulative count of Article Views (full-text article views including HTML views, PDF and ePub downloads, according to the available data) and Abstracts Views on Vision4Press platform.
Data correspond to usage on the plateform after 2015. The current usage metrics is available 48-96 hours after online publication and is updated daily on week days.
Initial download of the metrics may take a while.