Fig. 5
Download original image
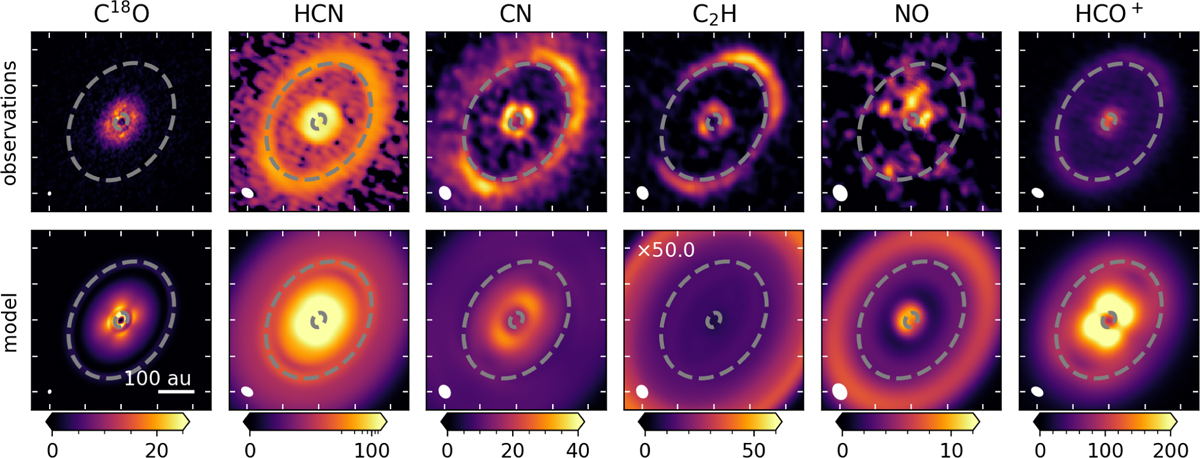
Integrated intensity (moment 0) maps of C18O, HCN, CN, C2H, NO, and HCO+ emission in the HD 100546 disk. The top row presents the observations (Pérez et al. 2020; Wölfer et al. 2024; Booth et al. 2024) and the bottom row the predictions of the fiducial model. All intensities are in mJy km s−1 beam−1. The dotted grey ellipses indicate the dust rings seen in the high spatial resolution (inner ring) and in the moderate spatial resolution (outer ring) 0.9 mm continuum. The tickmarks on the panels are spaced by 1″, the horizontal bar in the bottom left panel indicates a 100 au scale. The HCN is shown on a logarithmic scale to highlight the weak outer ring and the modelled C2H emission has been multiplied by a factor of 50. The beam of each of the observations is indicated with the white ellipse in the bottom left corner.
Current usage metrics show cumulative count of Article Views (full-text article views including HTML views, PDF and ePub downloads, according to the available data) and Abstracts Views on Vision4Press platform.
Data correspond to usage on the plateform after 2015. The current usage metrics is available 48-96 hours after online publication and is updated daily on week days.
Initial download of the metrics may take a while.