Fig. 4
Download original image
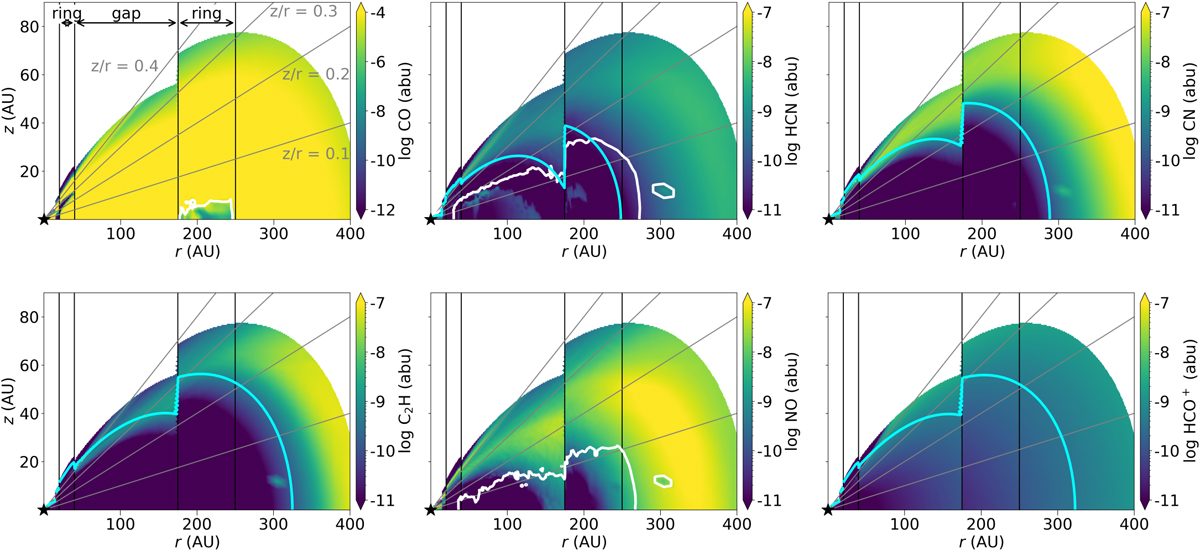
2D abundance maps of CO, HCN, CN, C2H, NO, and HCO+ in the fiducial model. Note that the CO abundance is shown on a different colorscale. The white contour indicates the snowline of CO, HCN, and NO in their respective channels. The blue contour shows the critical density assuming a temperature of 50 K. Only the regions with a gas number density above 105 cm−3 are shown. As the CO and NO critical densities are lower than this, those contours are not shown in the respective panels.
Current usage metrics show cumulative count of Article Views (full-text article views including HTML views, PDF and ePub downloads, according to the available data) and Abstracts Views on Vision4Press platform.
Data correspond to usage on the plateform after 2015. The current usage metrics is available 48-96 hours after online publication and is updated daily on week days.
Initial download of the metrics may take a while.