Open Access
Fig. B.14
Download original image
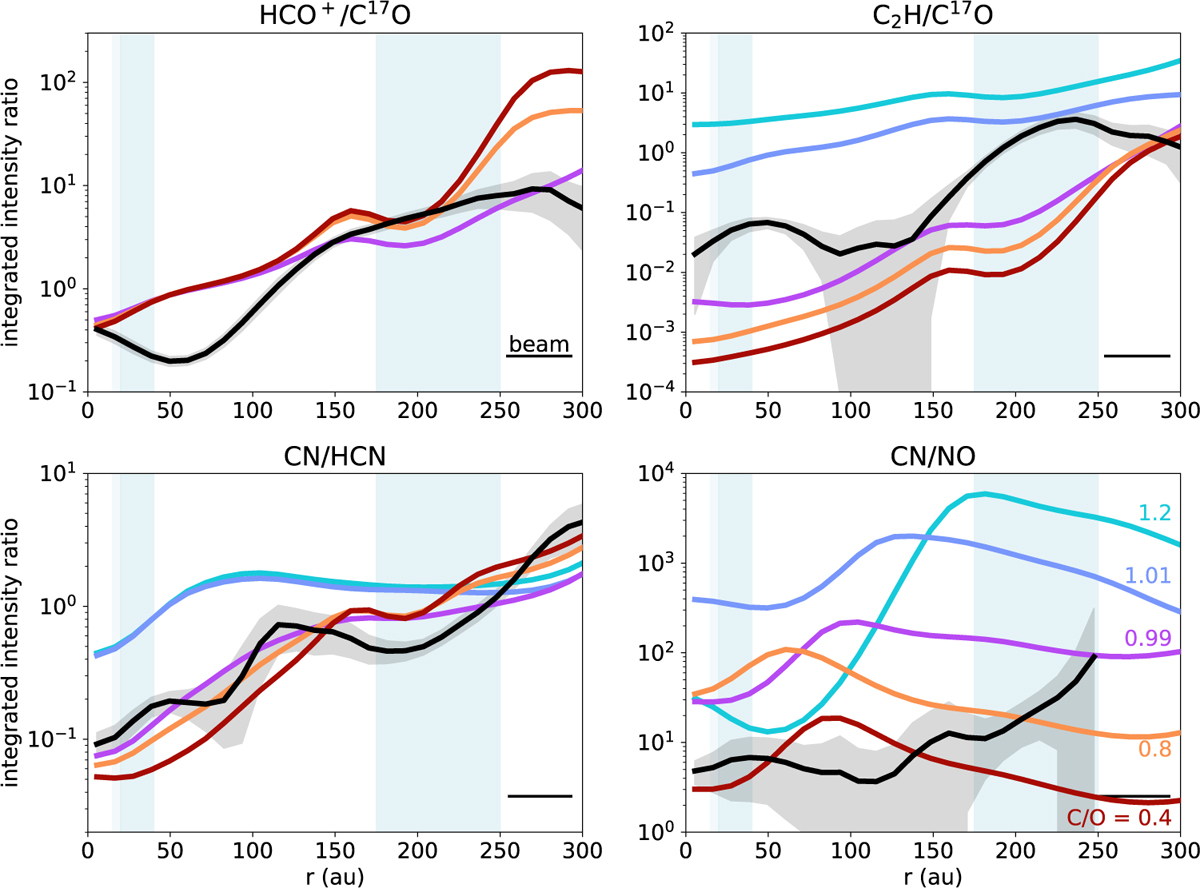
Emission line ratios of HCO+/CO (top left), C2H/CO (top right), CN/HCN (bottom left), and CN/NO (bottom right) for different gas gap depths. The black line indicated the observed emission line ratio for each pair.
Current usage metrics show cumulative count of Article Views (full-text article views including HTML views, PDF and ePub downloads, according to the available data) and Abstracts Views on Vision4Press platform.
Data correspond to usage on the plateform after 2015. The current usage metrics is available 48-96 hours after online publication and is updated daily on week days.
Initial download of the metrics may take a while.