Open Access
Fig. B.7
Download original image
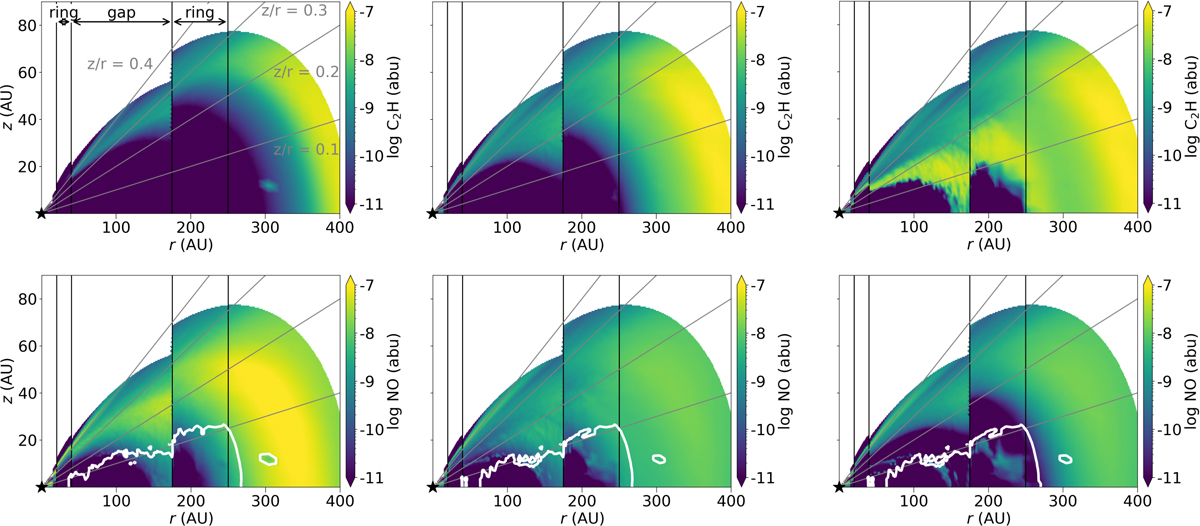
C2H (top row) and NO (bottom row) abundance for different C/O ratios. From left to right: C/O = 0.4 (fiducial value), 0.99, and 1.01. Only the regions with a gas number density above 105 cm−3 are shown. The white contour indicates the NO snowline.
Current usage metrics show cumulative count of Article Views (full-text article views including HTML views, PDF and ePub downloads, according to the available data) and Abstracts Views on Vision4Press platform.
Data correspond to usage on the plateform after 2015. The current usage metrics is available 48-96 hours after online publication and is updated daily on week days.
Initial download of the metrics may take a while.