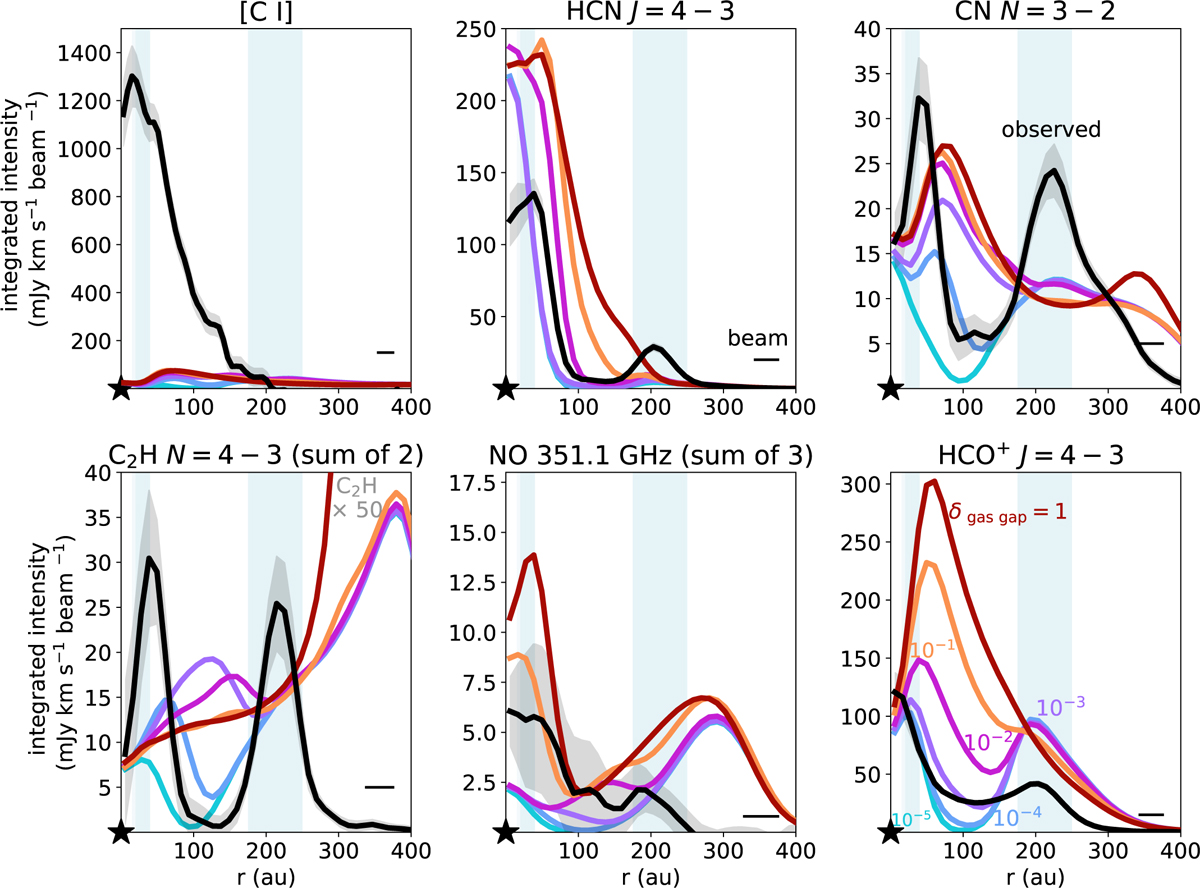
Fig. B.5
Download original image
Azimuthally averaged radial profiles of the [C I], HCN, CN, C2H, NO, and HCO+ emission predicted by models with a gas gap depth of one (no gap; dark red), 10−1 (orange), 10−2 (pink), 10−3 (purple), 10−4 (blue), and 10−5 (very deep gap; light blue). The C2H emission is increased by a factor of 50 for all models to show it on the same scale as the observations. The peak C2H intensity of the full disk model is 2 mJy km s−1 beam−1. The small dust density is dropped by the same factor in the gap. The observed intensities are indicated with the black lines.
Current usage metrics show cumulative count of Article Views (full-text article views including HTML views, PDF and ePub downloads, according to the available data) and Abstracts Views on Vision4Press platform.
Data correspond to usage on the plateform after 2015. The current usage metrics is available 48-96 hours after online publication and is updated daily on week days.
Initial download of the metrics may take a while.