Fig. B.3
Download original image
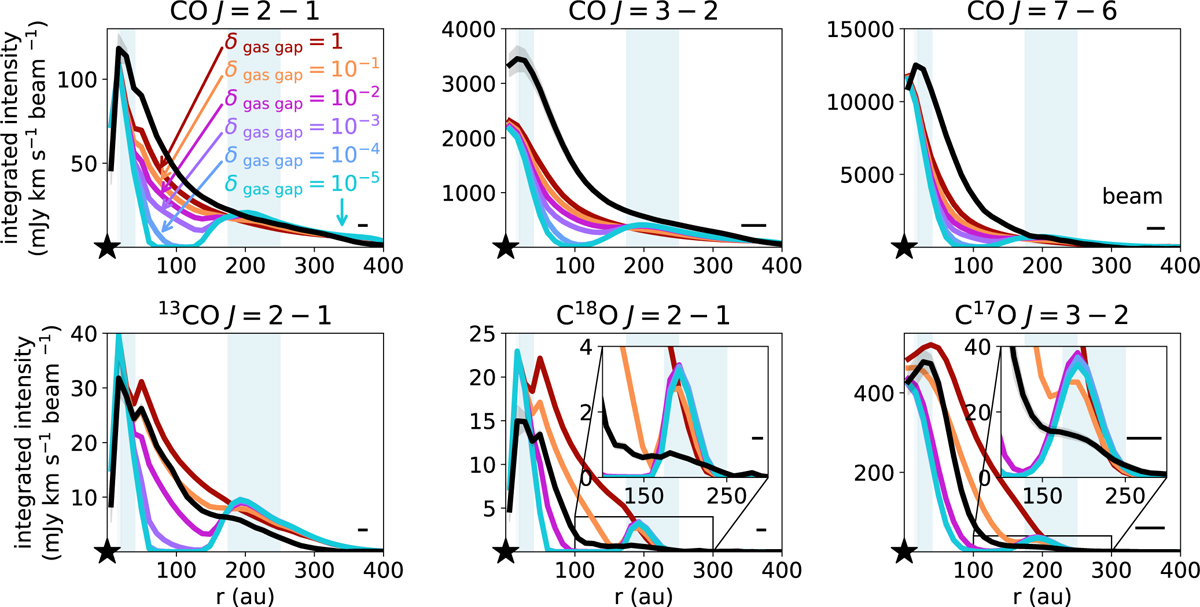
Azimuthally averaged radial profiles of the dust and CO isotopologue emission observed in the HD 100546 disk (black) together with model predictions for different gaps. In the models, the gas density in the gap (40 − 175 au) is reduced by a factor of 1 (no gap; dark red), 10−1 (orange), 10−2 (pink), 10−3 (purple), 10−4 (blue), and 10−5 (very deep gap; light blue). For all these models, the drop in the small dust density follows that of the gas. The beam is indicated with the horizontal bar in the bottom right corner of each panel.
Current usage metrics show cumulative count of Article Views (full-text article views including HTML views, PDF and ePub downloads, according to the available data) and Abstracts Views on Vision4Press platform.
Data correspond to usage on the plateform after 2015. The current usage metrics is available 48-96 hours after online publication and is updated daily on week days.
Initial download of the metrics may take a while.