Fig. B.1
Download original image
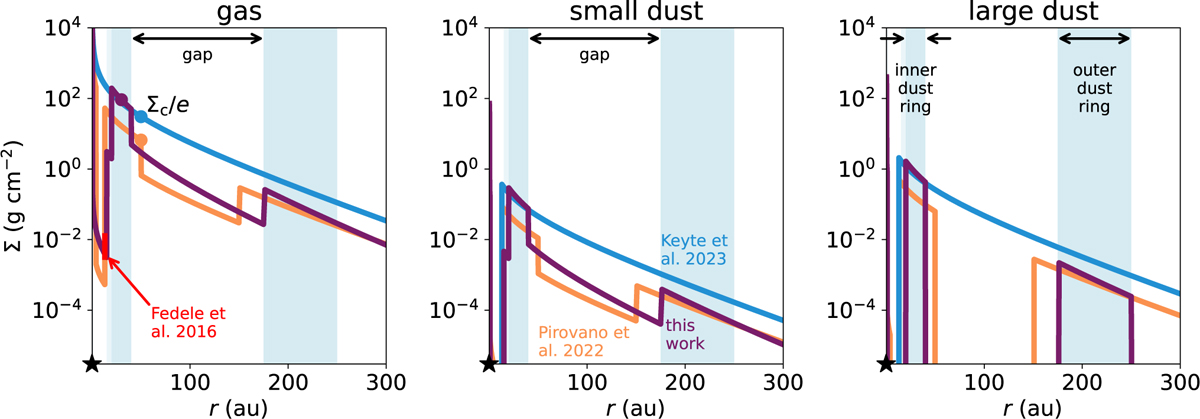
Surface density of the gas (left), small dust (middle), and large dust (right) in three models for the HD 100546 disk. The blue lines show the full gas disk model presented in Keyte et al. (2023), the orange lines show the model presented in Pirovano et al. (2022), and the purple lines show the model presented in this work. The shaded blue background indicates the dusty inner disk and the dust rings modelled in this work. The surface density ∑c/e at rc is indicated with a scatter point in the left panel.
Current usage metrics show cumulative count of Article Views (full-text article views including HTML views, PDF and ePub downloads, according to the available data) and Abstracts Views on Vision4Press platform.
Data correspond to usage on the plateform after 2015. The current usage metrics is available 48-96 hours after online publication and is updated daily on week days.
Initial download of the metrics may take a while.