Fig. 11
Download original image
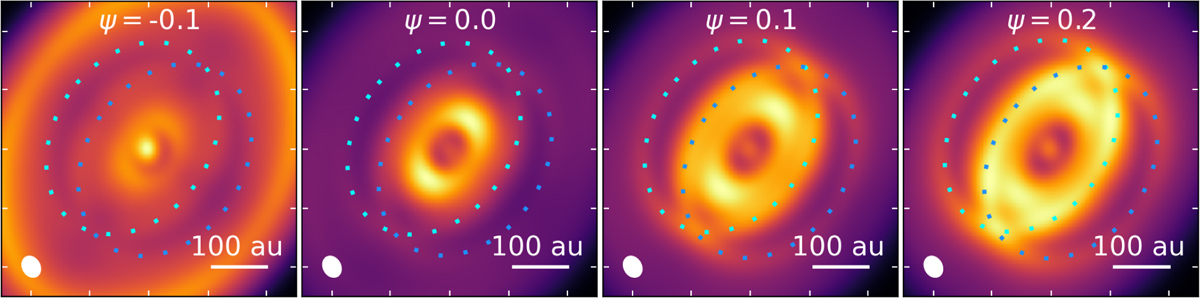
Moment 0 maps of the CN emission for models with different flaring indices from ψ = −0.1 to +0.2. The light and dark blue ellipses indicate the projected location at which the modelled CN number density peaks at the inner rim of the outer dust ring, which corresponds to z = 53–68 au. The panels are shown on individual colourscales for clarity.
Current usage metrics show cumulative count of Article Views (full-text article views including HTML views, PDF and ePub downloads, according to the available data) and Abstracts Views on Vision4Press platform.
Data correspond to usage on the plateform after 2015. The current usage metrics is available 48-96 hours after online publication and is updated daily on week days.
Initial download of the metrics may take a while.