Fig. 9.

Download original image
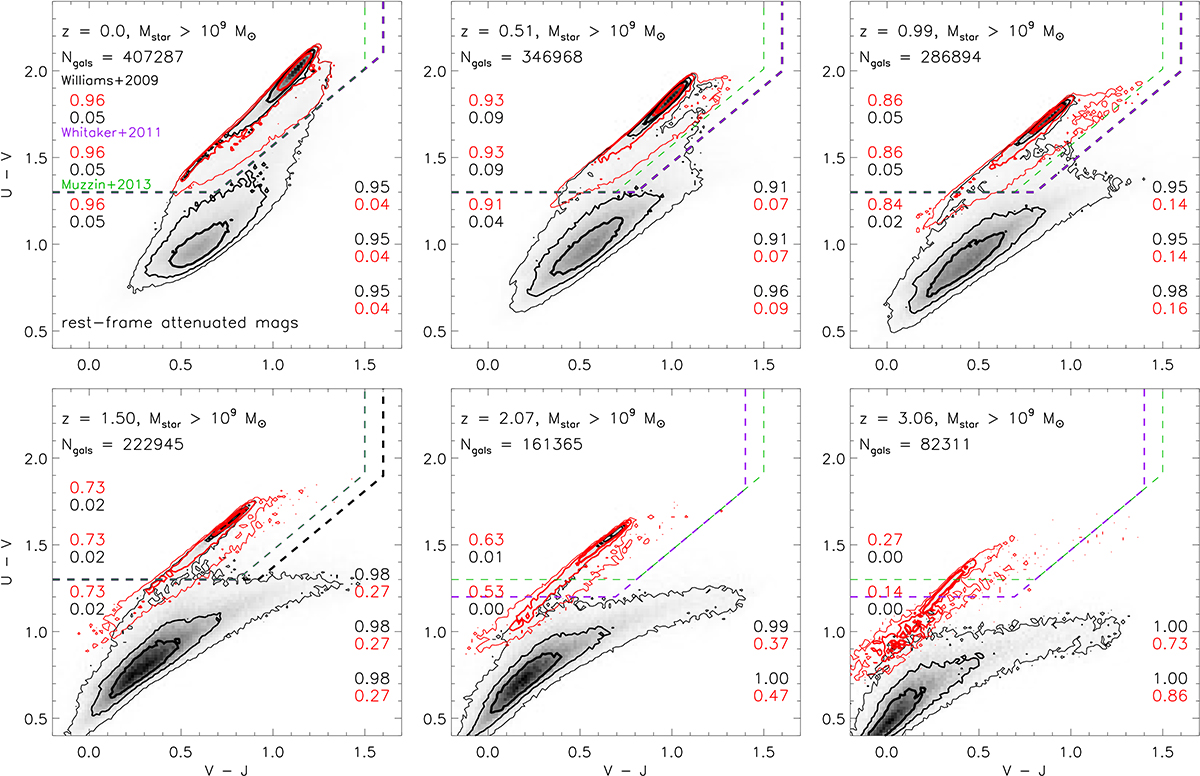
U − V versus V − J diagram for model galaxies at different cosmic epochs. Grey shaded regions show the distributions of all model galaxies more massive than ∼109 M⊙ at each redshift. Contours mark the regions enclosing 90, 60, and 30% of the galaxies. The red contours show the corresponding contour levels for galaxies that are classified as quiescent according to their sSFR. Dashed lines indicate the regions typically considered for a photometric selection of passive galaxies, in different studies. The fractions given in each panel indicate the completeness and contamination of the passive and active samples selected using the UVJ diagram (see text for details).
Current usage metrics show cumulative count of Article Views (full-text article views including HTML views, PDF and ePub downloads, according to the available data) and Abstracts Views on Vision4Press platform.
Data correspond to usage on the plateform after 2015. The current usage metrics is available 48-96 hours after online publication and is updated daily on week days.
Initial download of the metrics may take a while.


