Fig. 8.
Download original image
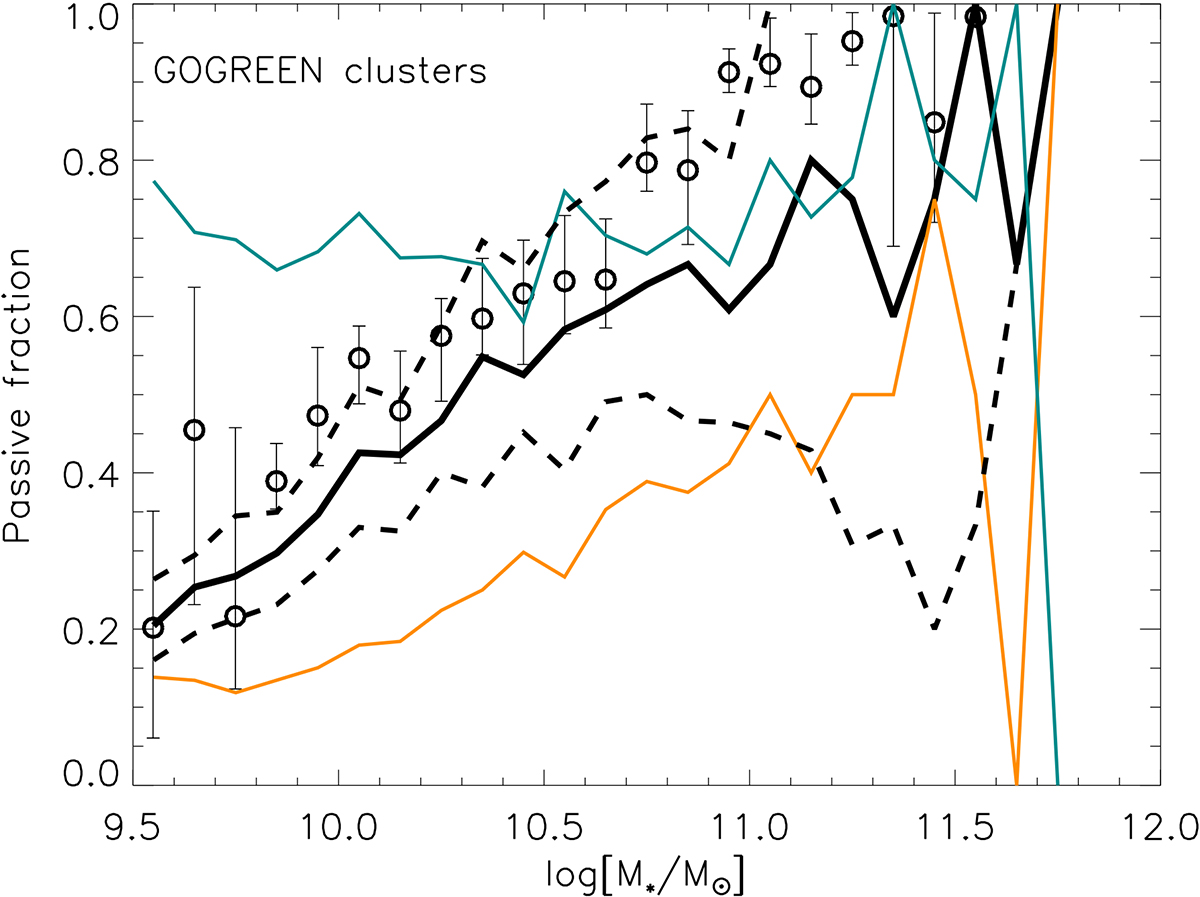
Passive fraction in the cluster environment at z ∼ 1. Lines show predictions from the models considered in this study, while symbols with error bars show the observational estimates from van der Burg et al. (2020). The dashed lines show the area enclosed by the 20th and 80th percentiles of the quiescent fractions obtained, for each galaxy stellar mass bin, when considering 25 samples of simulated haloes that match the mass and redshift distributions of the GOGREEN sample (see text for details). We show the dashed lines only for the GAEA2023 model for clarity. All model lines shown in this figure assume an uncertainty in stellar mass of 0.25 dex.
Current usage metrics show cumulative count of Article Views (full-text article views including HTML views, PDF and ePub downloads, according to the available data) and Abstracts Views on Vision4Press platform.
Data correspond to usage on the plateform after 2015. The current usage metrics is available 48-96 hours after online publication and is updated daily on week days.
Initial download of the metrics may take a while.