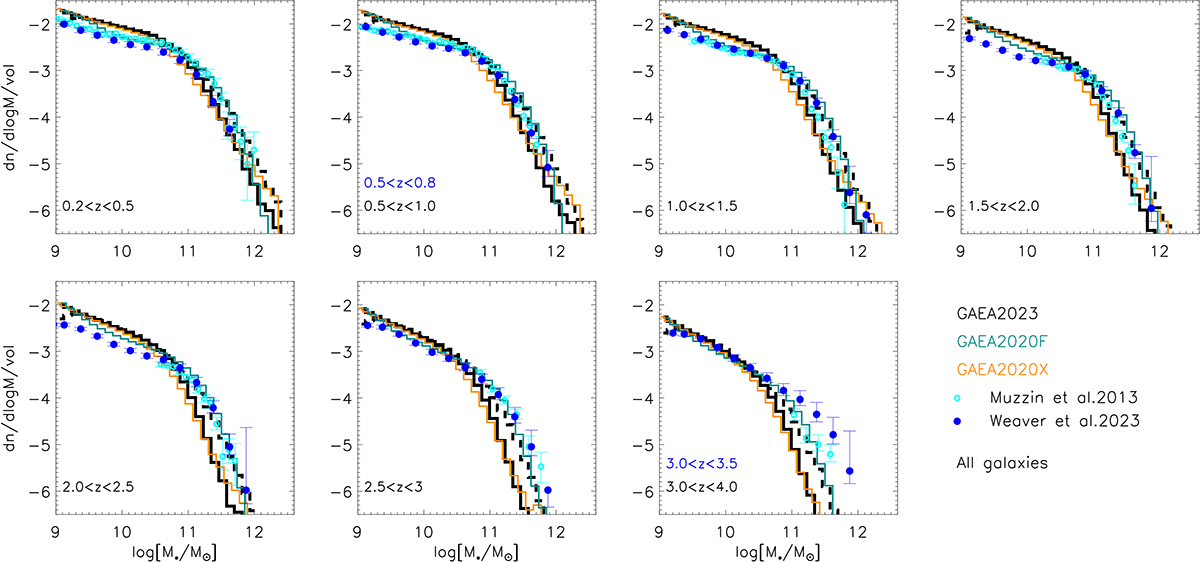
Fig. 5.
Download original image
Galaxy stellar mass function at different cosmic epochs. Symbols with error bars correspond to the observational estimates published in Muzzin et al. (2013, in this case we are showing only the 1/Vmax estimates published in this study) and Weaver et al. (2023). Solid lines correspond to predictions from the models considered in this study, as indicated in the legend. The dashed line in each panel shows, for the GAEA2023 model only, the corresponding predictions obtained assuming that the stellar masses have uncertainties that are Gaussian distributed with a width of 0.25 dex.
Current usage metrics show cumulative count of Article Views (full-text article views including HTML views, PDF and ePub downloads, according to the available data) and Abstracts Views on Vision4Press platform.
Data correspond to usage on the plateform after 2015. The current usage metrics is available 48-96 hours after online publication and is updated daily on week days.
Initial download of the metrics may take a while.