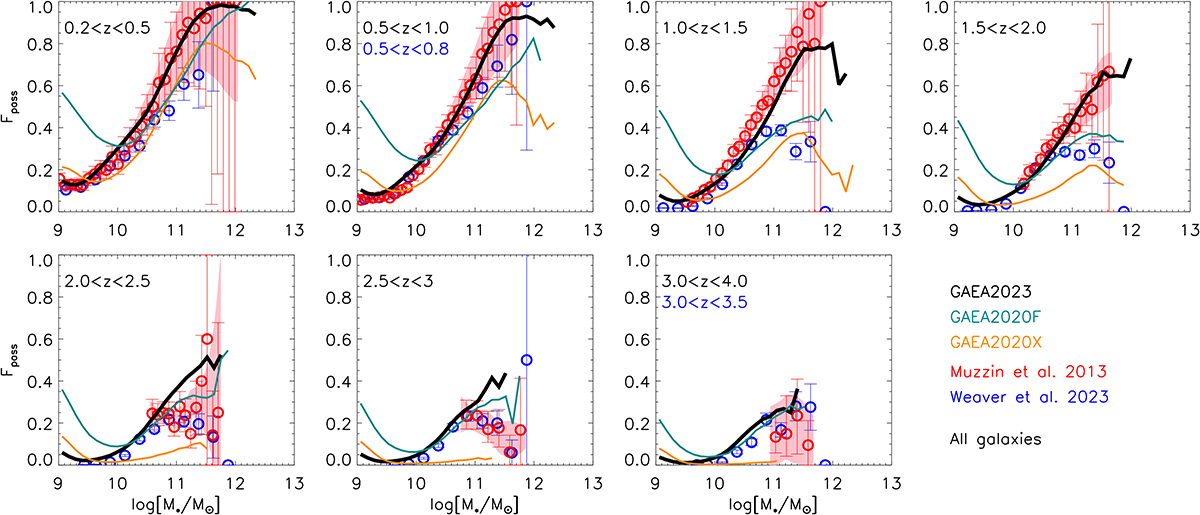
Fig. 4.
Download original image
Passive fraction at different cosmic epochs. Lines correspond to predictions from the models considered in this study. The shaded area and red symbols with error bars show observational estimates from Muzzin et al. (2013). Specifically, the shaded areas show the 1/Vmax measurements, while the open symbols with error bars show the maximum-likelihood measurements (see bottom panels of Fig. 6 in Muzzin et al. 2013). The blue symbols with error bars correspond to the observational estimates by Weaver et al. (2023). A sSFR cut has been employed to select model passive galaxies (see text for details), while the observational samples are based on different colour-colour selections, a SED fitting estimate of the galaxy stellar mass, and photometric redshifts estimates.
Current usage metrics show cumulative count of Article Views (full-text article views including HTML views, PDF and ePub downloads, according to the available data) and Abstracts Views on Vision4Press platform.
Data correspond to usage on the plateform after 2015. The current usage metrics is available 48-96 hours after online publication and is updated daily on week days.
Initial download of the metrics may take a while.