Fig. 2.
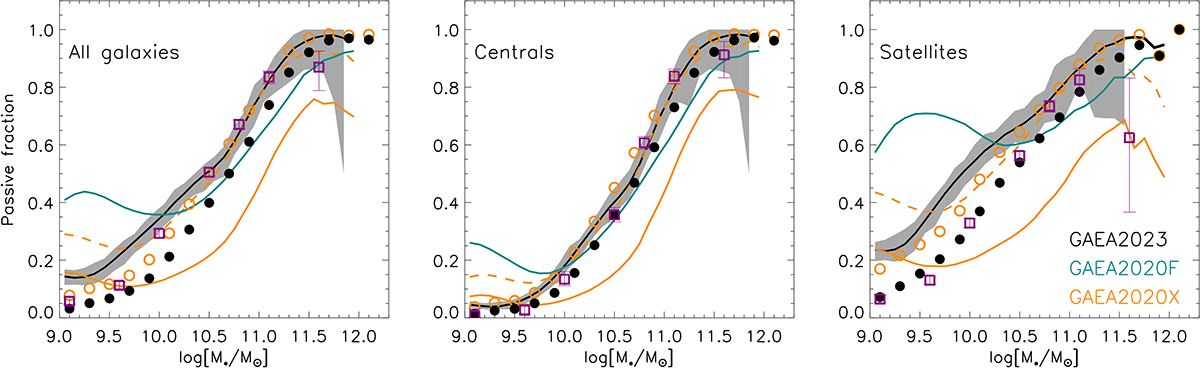
Download original image
Passive fractions for all galaxies (left panel), central galaxies (middle panel), and satellites (right panels). Symbols correspond to observational measurements. In particular: squares correspond to estimates from Davies et al. (2019) based on the GAMA survey, and adopt a log(sSFR) threshold of −10.5 yr−1 to identify passive fractions. Filled and empty circles correspond to measurements based on SDSS DR8 and are obtained assuming a threshold of −11 yr−1 and −10.6 yr−1, respectively. Solid lines correspond to predictions from different models, as indicated in the legend, assuming a log(sSFR) threshold of −11.0 yr−1 to select passive galaxies. The grey regions show the minimum-maximum fractions obtained when considering predictions from the GAEA2023 model from 125 independent boxes, each of 100 Mpc h−1 on a side. The dashed line shows predictions from the GAEA2020X model corresponding to a log(sSFR) threshold of −10.6 yr−1, as adopted in Xie et al. (2020).
Current usage metrics show cumulative count of Article Views (full-text article views including HTML views, PDF and ePub downloads, according to the available data) and Abstracts Views on Vision4Press platform.
Data correspond to usage on the plateform after 2015. The current usage metrics is available 48-96 hours after online publication and is updated daily on week days.
Initial download of the metrics may take a while.