Open Access
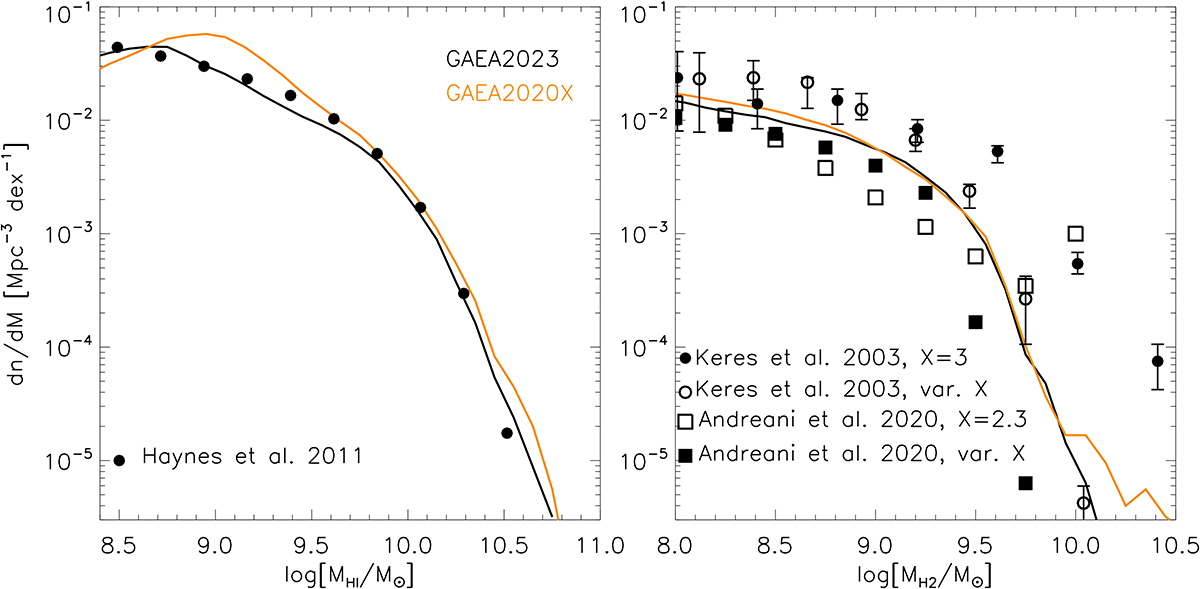
Fig. A.2.
Download original image
HI (left panel) and H2 (right panel) mass function at z = 0, compared with observational estimates. The solid black line corresponds to our GAEA2023 model, while the dark orange line shows model predictions from Xie et al. (2020).
Current usage metrics show cumulative count of Article Views (full-text article views including HTML views, PDF and ePub downloads, according to the available data) and Abstracts Views on Vision4Press platform.
Data correspond to usage on the plateform after 2015. The current usage metrics is available 48-96 hours after online publication and is updated daily on week days.
Initial download of the metrics may take a while.