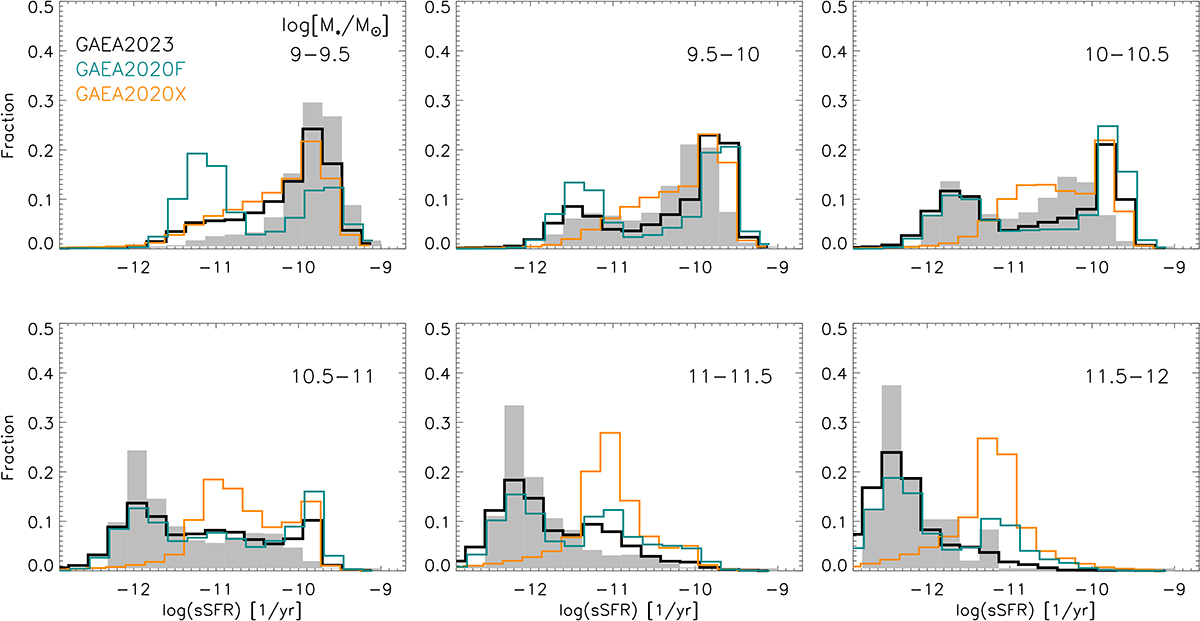
Fig. 1.
Download original image
Specific star formation rate distribution as predicted by the models indicated in the legend, and compared to observational estimates based on SDSS DR8 (grey shaded histograms – see text for details). Each panel corresponds to a different bin in galaxy stellar mass, as indicated in the top-right legend. The histograms corresponding to the GAEA2020X and GAEA2020F models have been slightly shifted (by 0.02 dex) to the left and right with respect to the GAEA2023 model for clarity.
Current usage metrics show cumulative count of Article Views (full-text article views including HTML views, PDF and ePub downloads, according to the available data) and Abstracts Views on Vision4Press platform.
Data correspond to usage on the plateform after 2015. The current usage metrics is available 48-96 hours after online publication and is updated daily on week days.
Initial download of the metrics may take a while.