Fig 13
Download original image
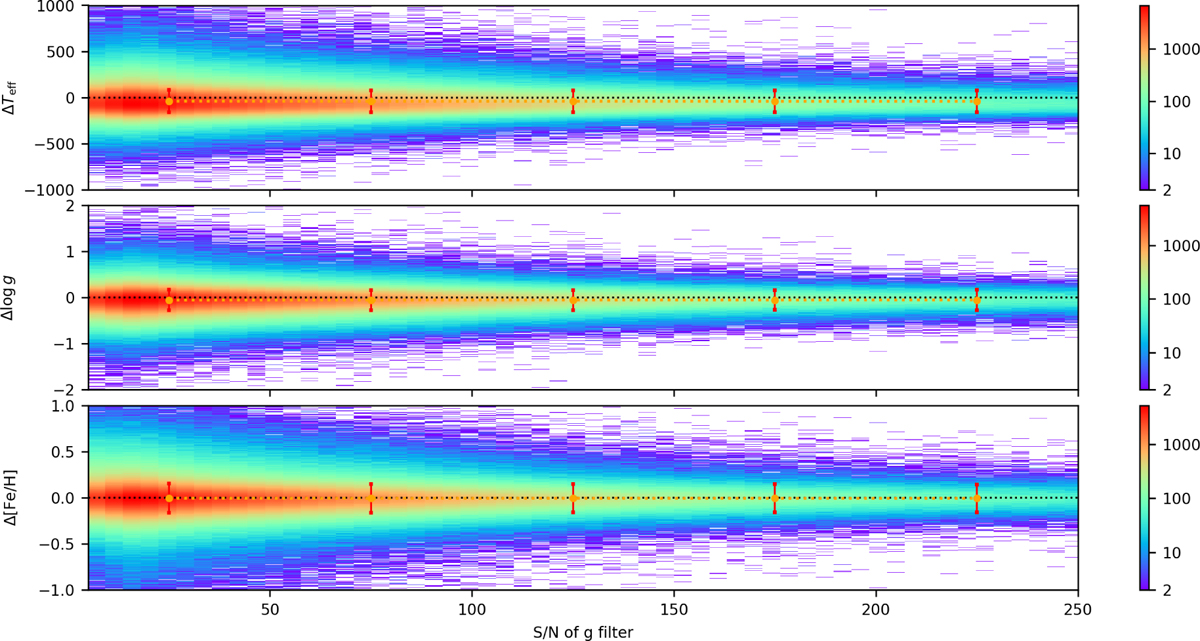
SOST and LAMOST DR8 parameter differences as a function of the spectral S/N. The black dashed line in the figure is the reference line where the difference is zero. We binned the S/N ([6, 50], [50, 100], [100, 150], [150, 200], and [200, 250]). The mean deviation is shown in orange, and the scatter of the residuals is indicated by the red line in the figure.
Current usage metrics show cumulative count of Article Views (full-text article views including HTML views, PDF and ePub downloads, according to the available data) and Abstracts Views on Vision4Press platform.
Data correspond to usage on the plateform after 2015. The current usage metrics is available 48-96 hours after online publication and is updated daily on week days.
Initial download of the metrics may take a while.