Fig. 9
Download original image
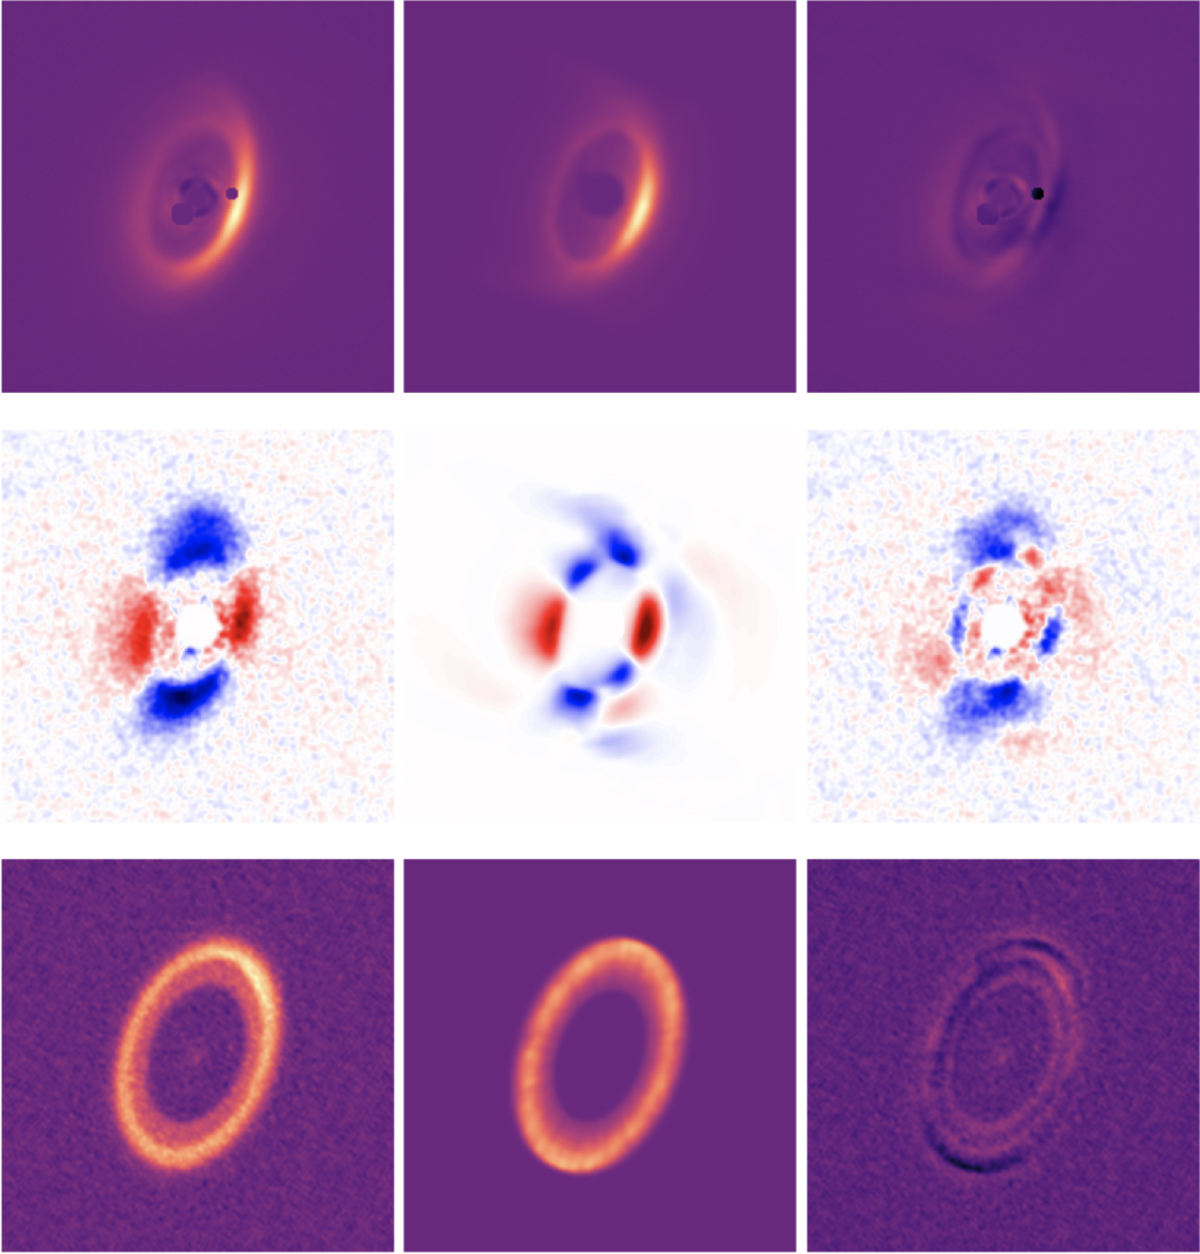
Comparison of Radmc3D preliminary two-zone model images with data. The figure shows poor fits to the polarimetry data. The left, middle, and right columns represent the data, model, and residual, respectively. The top, middle, and bottom rows are the Ks-band total intensity image, H-band Stokes Q image, and ALMA 870 μ image, respectively. The data and model images are of the same resolution.
Current usage metrics show cumulative count of Article Views (full-text article views including HTML views, PDF and ePub downloads, according to the available data) and Abstracts Views on Vision4Press platform.
Data correspond to usage on the plateform after 2015. The current usage metrics is available 48-96 hours after online publication and is updated daily on week days.
Initial download of the metrics may take a while.