Fig. 5
Download original image
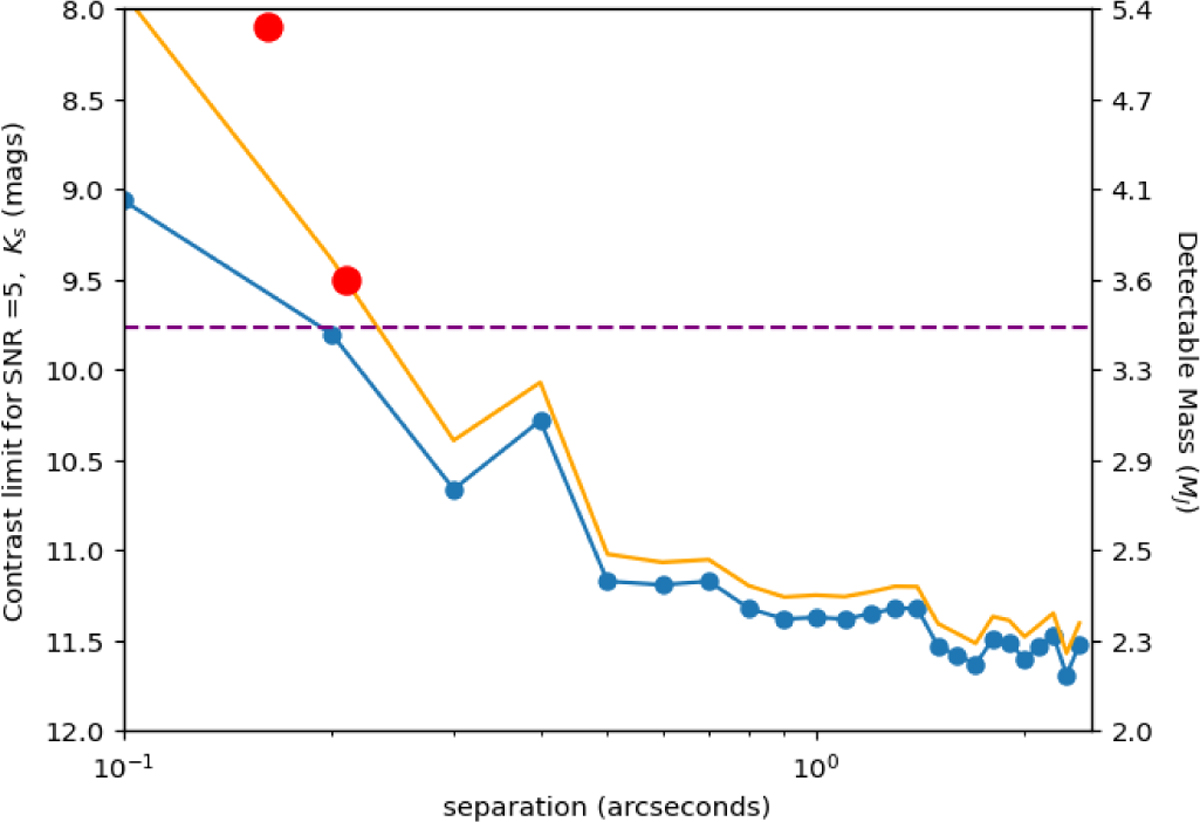
IRDIS Ks-band detection contrast limit for S/N >5 (shown with the blue curve). It was made from the simulated planet recovery, as explained in the main text. The orange line shows the limits corrected for small sample statistics according to Mawet et al. 2014. The mass detection limits are estimated from the DUSTY models, assuming an age of 5 Myr for PDS 70. The dashed line represents the detection limit at the brightest part of the disk.
Current usage metrics show cumulative count of Article Views (full-text article views including HTML views, PDF and ePub downloads, according to the available data) and Abstracts Views on Vision4Press platform.
Data correspond to usage on the plateform after 2015. The current usage metrics is available 48-96 hours after online publication and is updated daily on week days.
Initial download of the metrics may take a while.