Open Access
Fig. 1
Download original image
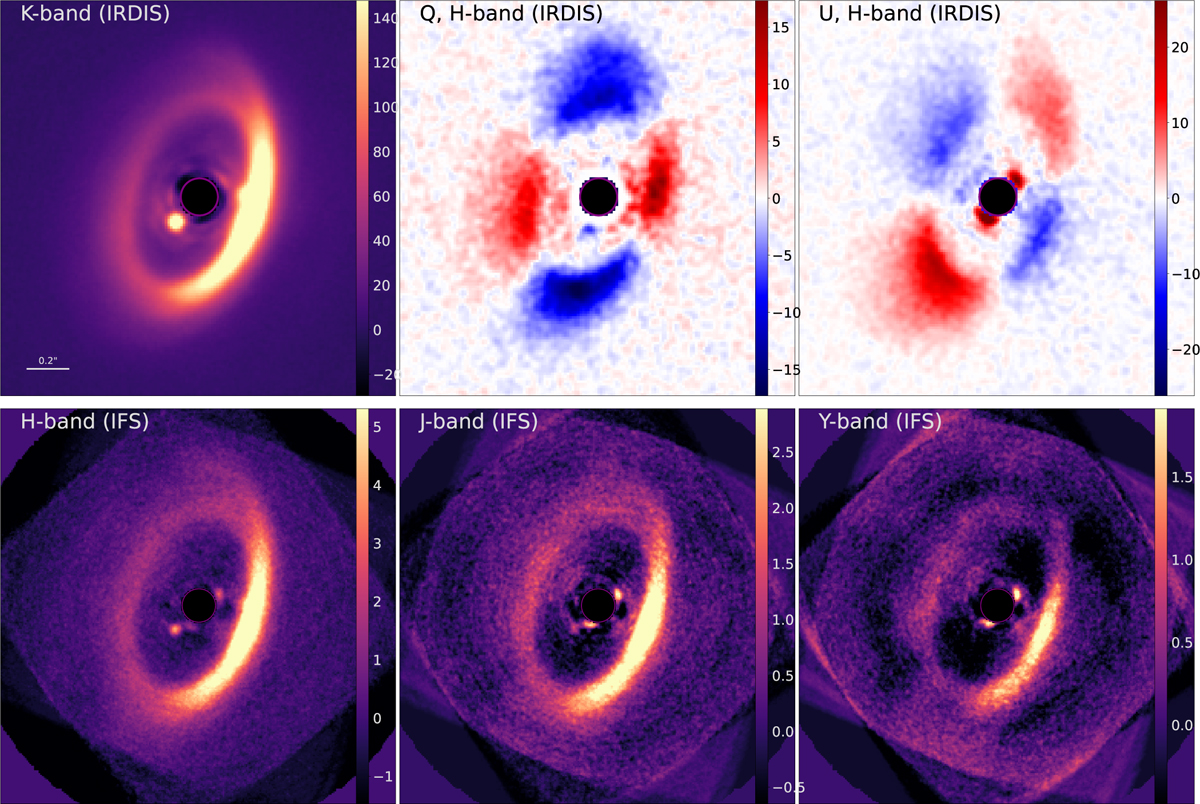
SPHERE Observations of PDS 70. Top row, left to right: IRDIS Ks-band, Stokes Q/H-band, and Stokes U/H-band images. Bottom row: H-, J-, and Y-band IFS observations, median combined over the typical band widths. North is up, east is left, and the black circle in the center is a mask over the coronagraphic region.
Current usage metrics show cumulative count of Article Views (full-text article views including HTML views, PDF and ePub downloads, according to the available data) and Abstracts Views on Vision4Press platform.
Data correspond to usage on the plateform after 2015. The current usage metrics is available 48-96 hours after online publication and is updated daily on week days.
Initial download of the metrics may take a while.