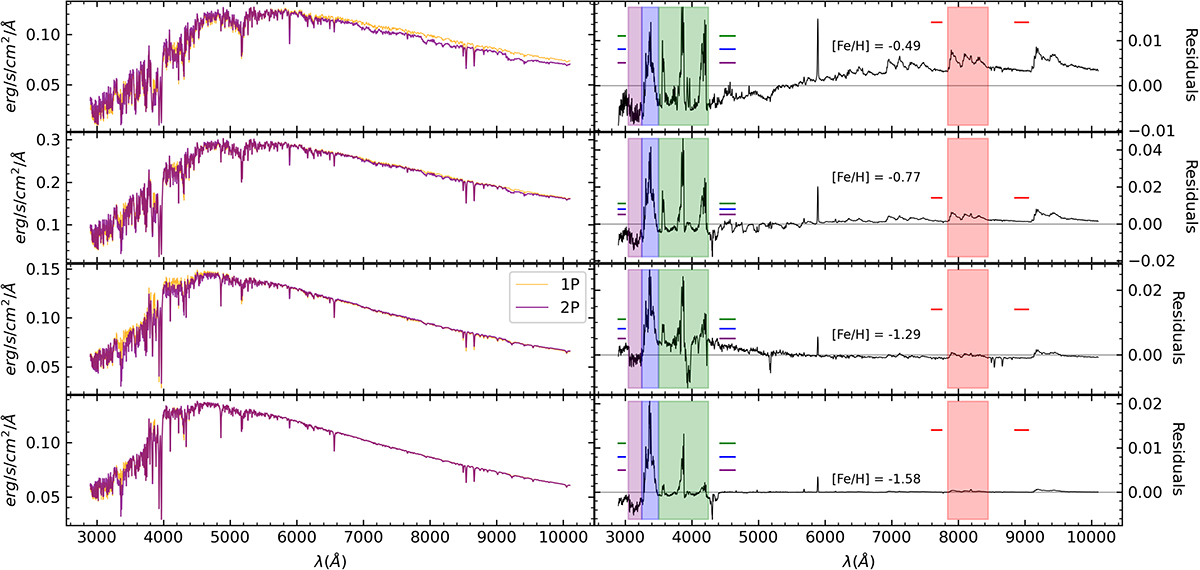
Fig. 3.
Download original image
Comparisons between integrated spectra and regions sensitive to the MPs effects. Left panel: model SSPs. Gen.1 indicates models with the standard mixture of the first generation, i.e. α-enh. Gen.2 represents the modified mixture of the second generation, i.e. α– and Y–enhancements and ΔCNONa (it also considers the CN–ONa abundance variations). The iron abundances are indicated in the texts in the right panels. Right panel: residual flux between the first- and second-generation spectra for each iron abundance. The wavelength regions affected by the chemical variations typical of the second generation are shown, corresponding to changes in the CH/OH/NH and CN bands and to the Na D line strength. The coloured lines indicate the blue and red continua bandpass intervals that correspond to the central bandpass areas of the same colour.
Current usage metrics show cumulative count of Article Views (full-text article views including HTML views, PDF and ePub downloads, according to the available data) and Abstracts Views on Vision4Press platform.
Data correspond to usage on the plateform after 2015. The current usage metrics is available 48-96 hours after online publication and is updated daily on week days.
Initial download of the metrics may take a while.