Fig. 7.
Download original image
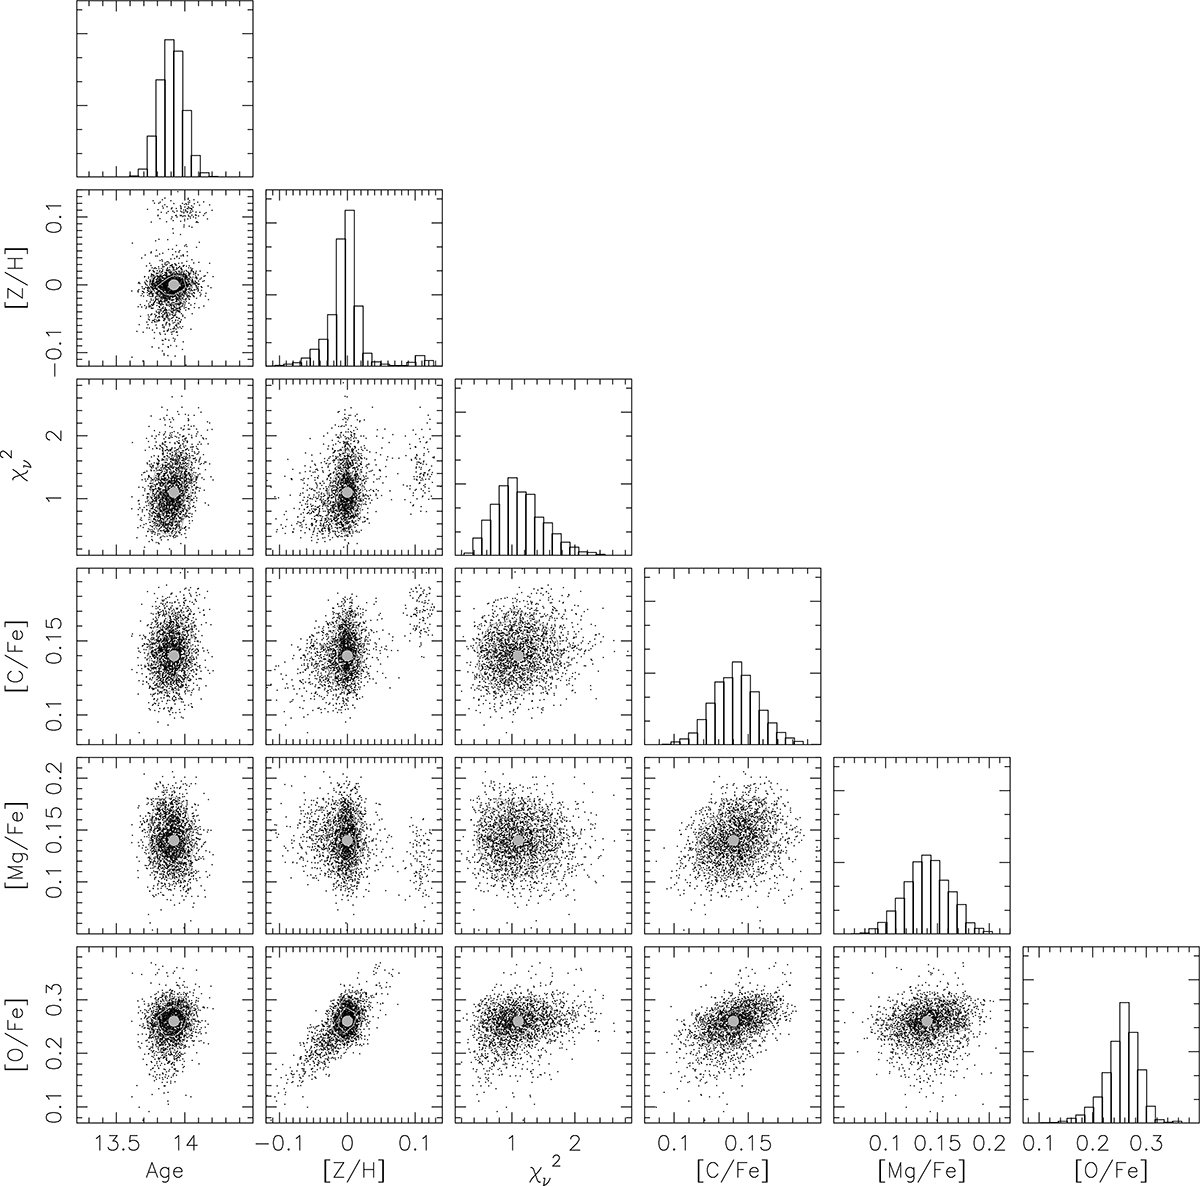
Corner plot showing the distribution of the best-fitting parameters, namely the age, metallicity, [C/Fe], [Mg/Fe], [O/Fe], as well as reduced chi-square, ![]() , for the outer aperture of the M31 bulge, when fitting both optical indices and CO lines, with EMILES Padova models (method EMILES iP, see Sect. 4.2). For each panel that plots a pair of different parameters, black points correspond to results for different bootstrap iterations, where observed line strengths are randomly shifted according to their uncertainties; gray curves are iso-density contours, with density levels corresponding to 1- and 2-sigma confidence contours for a two-dimensional random deviate; big gray dots are the best-fitting solutions, for the nominal values of line strengths.
, for the outer aperture of the M31 bulge, when fitting both optical indices and CO lines, with EMILES Padova models (method EMILES iP, see Sect. 4.2). For each panel that plots a pair of different parameters, black points correspond to results for different bootstrap iterations, where observed line strengths are randomly shifted according to their uncertainties; gray curves are iso-density contours, with density levels corresponding to 1- and 2-sigma confidence contours for a two-dimensional random deviate; big gray dots are the best-fitting solutions, for the nominal values of line strengths.
Current usage metrics show cumulative count of Article Views (full-text article views including HTML views, PDF and ePub downloads, according to the available data) and Abstracts Views on Vision4Press platform.
Data correspond to usage on the plateform after 2015. The current usage metrics is available 48-96 hours after online publication and is updated daily on week days.
Initial download of the metrics may take a while.