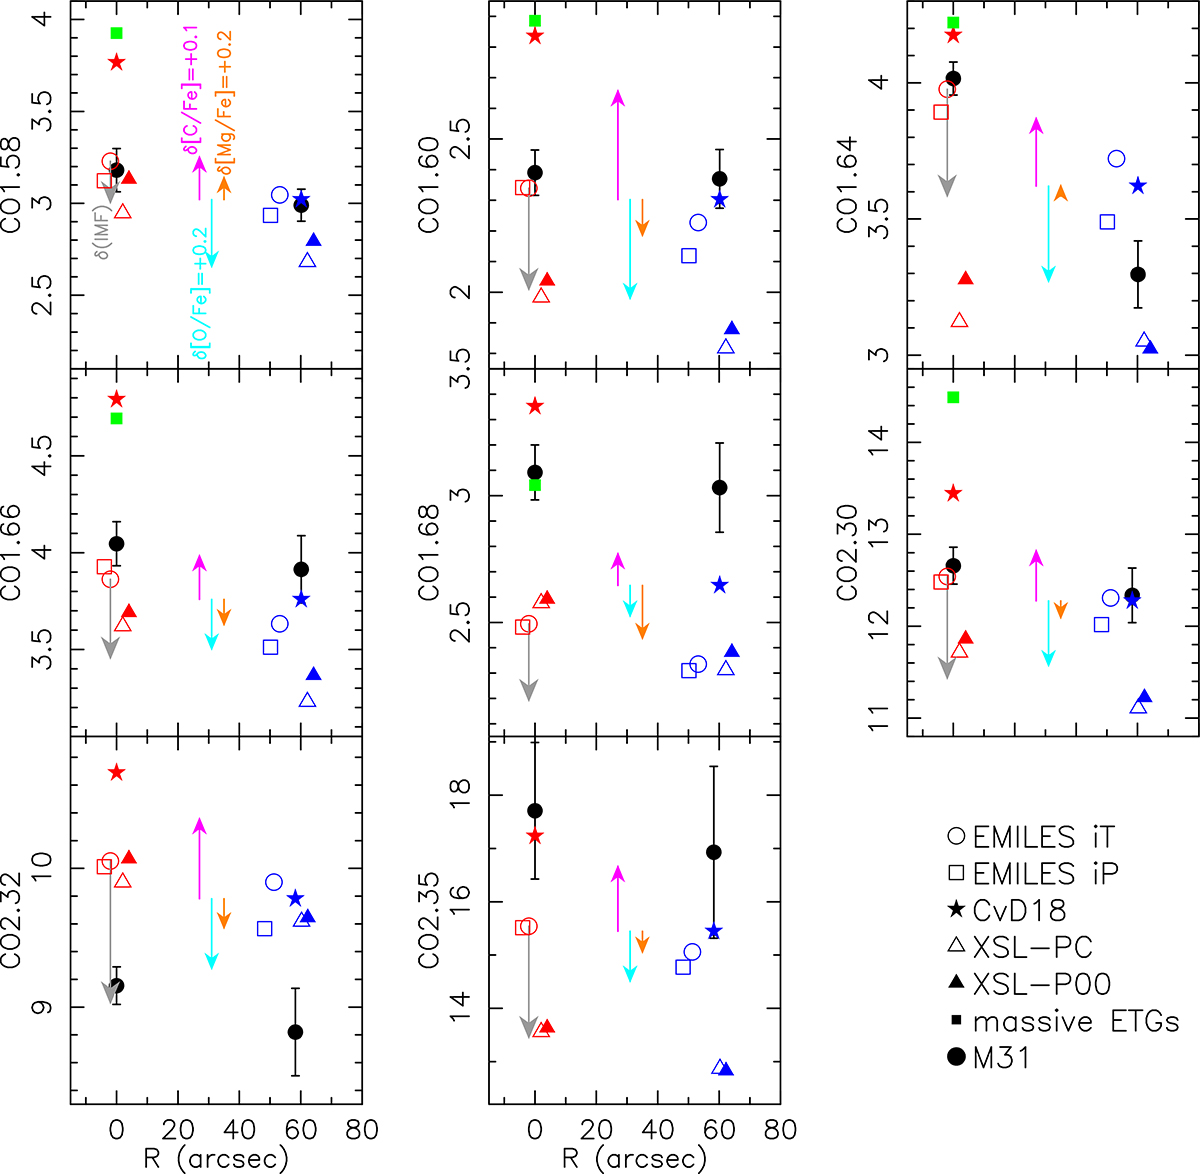
Fig. 4.

Download original image
Average line strengths of CO absorptions for the inner (R = 0″) and outer (R = 60″) reference bins of the M31 bulge (black circles with error bars) are compared to predictions of different stellar population models (see labels in the lower-right corner), namely E-MILES models with Teramo (“EMILES iT”) and Padova00 isochcrones (“EMILES iP”), CvD18 models, as well as XSL models based on Parsec and Padova00 isochrones (XSL-PC and XSL-P00), respectively. Model predictions for the inner (outer) bin, plotted with red (blue) colors, have been computed with 1SSP models, assuming representative values of age and metallicity from the analysis of optical indices (see the text). To perform a fair comparison among models, a Kroupa-like IMF is assumed. The green arrow shows the effect of adopting a more bottom-heavy IMF, as inferred from the optical (see Paper I), for EMILES Padova models. The magenta, cyan, and orange arrows show the effect of increasing [C/Fe], [O/Fe], and [Mg/Fe], abundance ratios, at fixed total metallicity (for CvD18 models), by +0.1, +0.2, and +0.2, respectively (see labels in the top–left panel). Note that the average line strengths of massive ETGs, available for CO2.30 and the other bluer CO indices (see ELV22a), are systematically higher than most models’ predictions and higher than the observed line strengths of the bulge, despite having a more bottom-heavy IMF (see the text).
Current usage metrics show cumulative count of Article Views (full-text article views including HTML views, PDF and ePub downloads, according to the available data) and Abstracts Views on Vision4Press platform.
Data correspond to usage on the plateform after 2015. The current usage metrics is available 48-96 hours after online publication and is updated daily on week days.
Initial download of the metrics may take a while.


