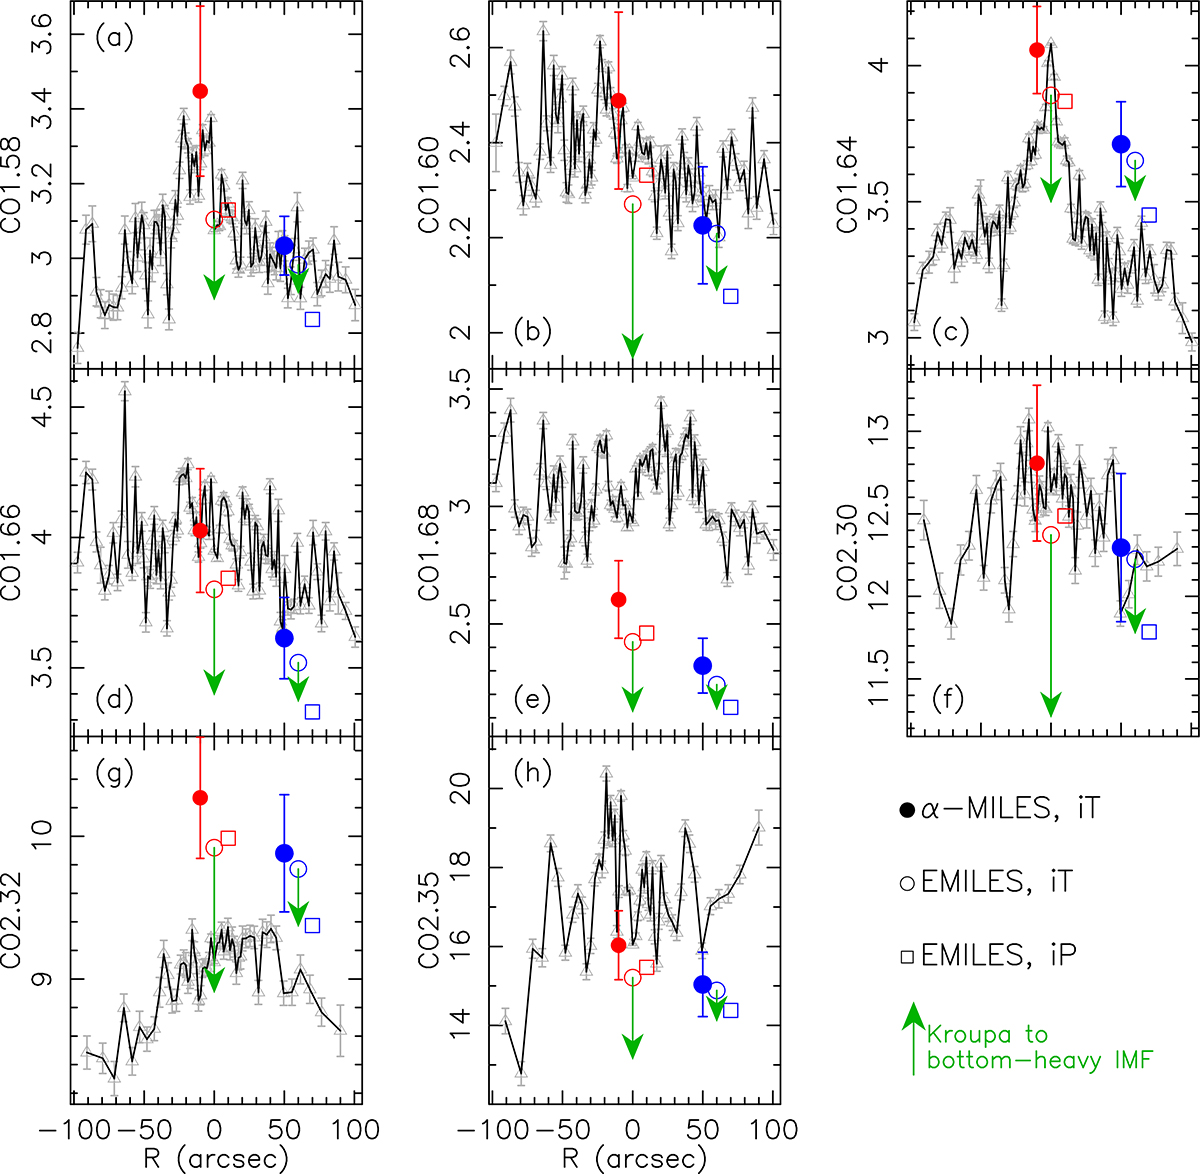
Fig. 3.
Download original image
Line strengths of H- and K-band CO absorption features are plotted as a function of galactocentric distance, R (in units of arcsec), for the bulge of M31. Negative and positive values of R correspond to opposite sides of the slit. From top to bottom, and left to right, the figure plots CO absorptions at increasing wavelengths. In each panel, measured line strengths are plotted with gray triangles, connected by a black line, and (1-sigma) error bars. The red and blue symbols plot model predictions for an inner (R ∼ 0″) and an outer (R ∼ 60″) representative aperture, respectively (see the text). Empty circles and squares correspond to Padova and Teramo EMILES 1SSP models (see labels in the lower–right), for a Kroupa-like IMF, with age and metallicity from the optical spectral range (see Paper I). Filled circles are predictions for Teramo models, with age and metallicity from α–MILES models in the optical. Note that, at a given radius, some shift has been applied among models for displaying reasons. The effect of a varying IMF, at fixed age and metallicity, is shown by green arrows. Since CO lines are prominent in giant stars, the arrows point downward in all panels.
Current usage metrics show cumulative count of Article Views (full-text article views including HTML views, PDF and ePub downloads, according to the available data) and Abstracts Views on Vision4Press platform.
Data correspond to usage on the plateform after 2015. The current usage metrics is available 48-96 hours after online publication and is updated daily on week days.
Initial download of the metrics may take a while.