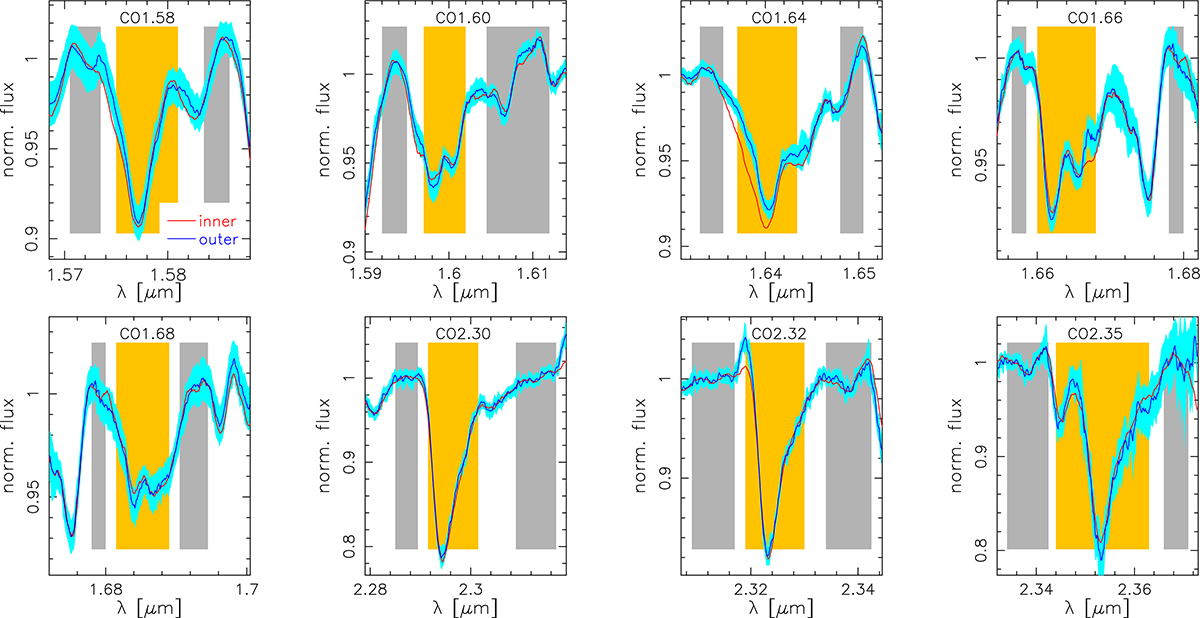
Fig. 2.
Download original image
Comparison of the “inner” (red) and “outer” (blue) spectra of M31 (see the legend in the top–left panel), in the spectral regions of the NIR CO features (see the text). Each panel corresponds to a different CO index, with wavelengths increasing from left to right, and top to bottom. The central passbands (pseudocontinuua) of the COs are marked with shaded orange (gray) regions. For a given index, each spectrum is normalized by a line passing through the pseudocontinua regions. For illustrative purposes, we show the (1-sigma) uncertainties on the outer spectrum only, plotted as a shaded cyan region.
Current usage metrics show cumulative count of Article Views (full-text article views including HTML views, PDF and ePub downloads, according to the available data) and Abstracts Views on Vision4Press platform.
Data correspond to usage on the plateform after 2015. The current usage metrics is available 48-96 hours after online publication and is updated daily on week days.
Initial download of the metrics may take a while.