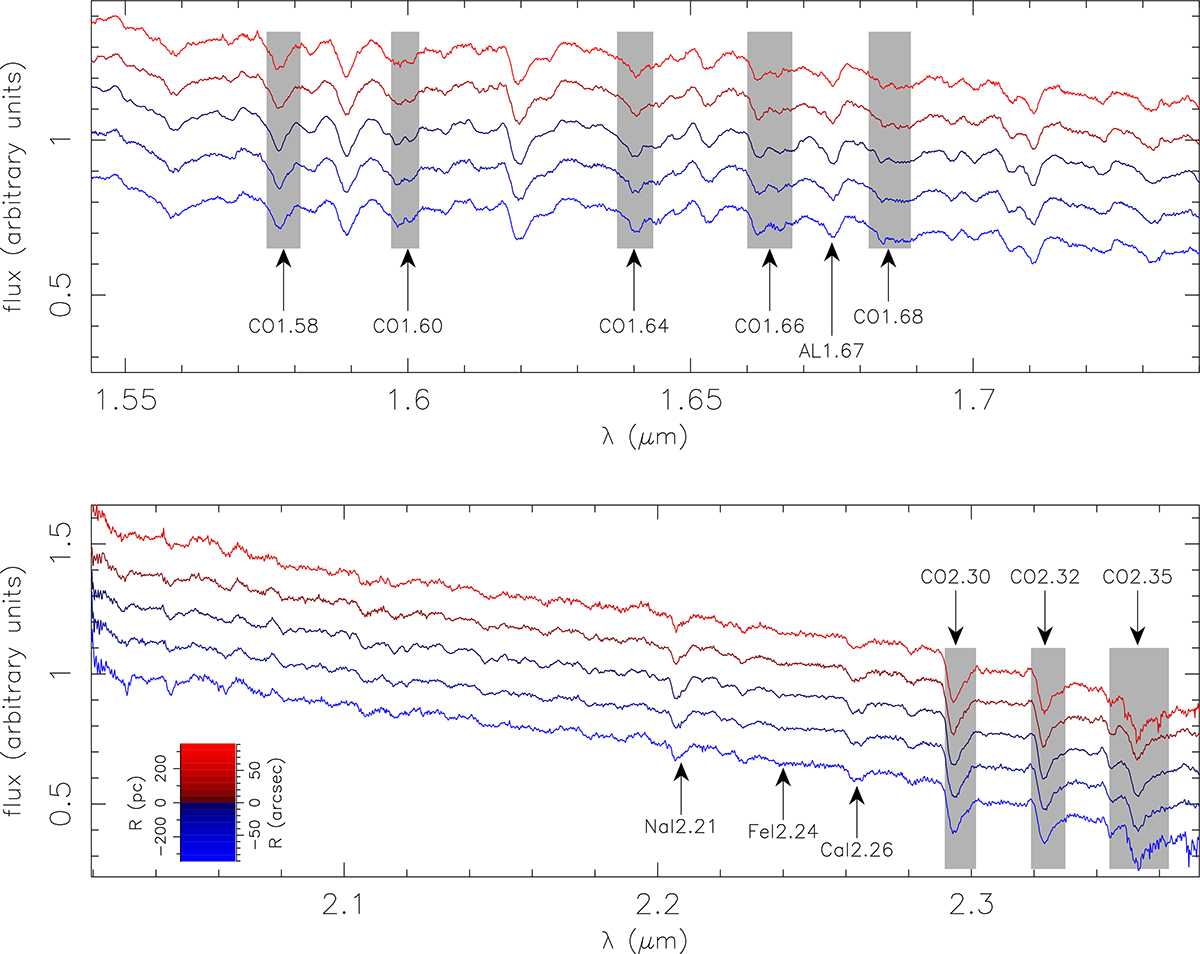
Fig. 1.
Download original image
H-(top) and K-(bottom) band radially binned spectra for the bulge of M31, observed with LUCI@LBT. In each panel, the main absorption features from Eftekhari et al. (2021, hereafter EVL21) are marked with a black arrow. Gray bands mark the sidebands of the CO absorption features analyzed in the present work, from H throughout K band (see the text). Spectra with different colors correspond to different galactocentric distances. The distance to the center along the slit, R, is encoded with colors from blue (the southwest side of the slit) through red (northeast), as shown by the inset colored bar in the bottom panel.
Current usage metrics show cumulative count of Article Views (full-text article views including HTML views, PDF and ePub downloads, according to the available data) and Abstracts Views on Vision4Press platform.
Data correspond to usage on the plateform after 2015. The current usage metrics is available 48-96 hours after online publication and is updated daily on week days.
Initial download of the metrics may take a while.