Fig. 8
Download original image
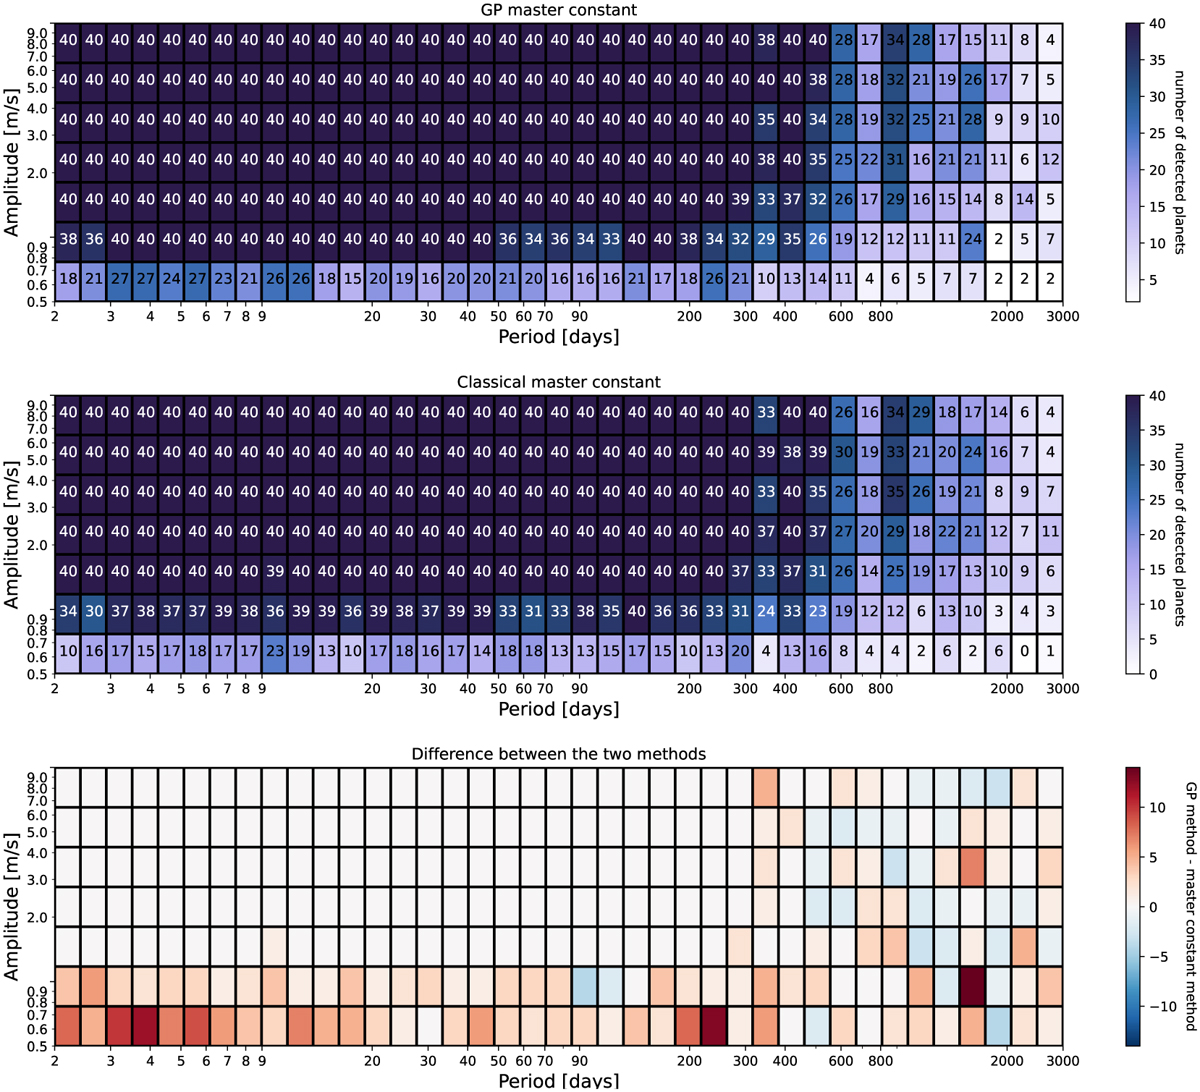
Number of planets detected as a function of the period and semi-amplitude of the RV signal. The upper panel depicts the number of planets detected using the new GP master constant correction, and the second panel shows the classical master constant correction. The grid cell colours indicate the number of planets detected with the colour scale at the right. The darkest colour means that more planets were detected. White cells contain no detected planets. The last panel shows the difference between the two methods regarding detected planets. Red means that more planets are detected with the GP method, and blue means that more planets are detected with the classical method. White cells mean that both methods detected the same number of planets. A planet is detected if log10(FAP) ≤ −1.3 and the orbital period is close to the injected period.
Current usage metrics show cumulative count of Article Views (full-text article views including HTML views, PDF and ePub downloads, according to the available data) and Abstracts Views on Vision4Press platform.
Data correspond to usage on the plateform after 2015. The current usage metrics is available 48-96 hours after online publication and is updated daily on week days.
Initial download of the metrics may take a while.