Fig. 5
Download original image
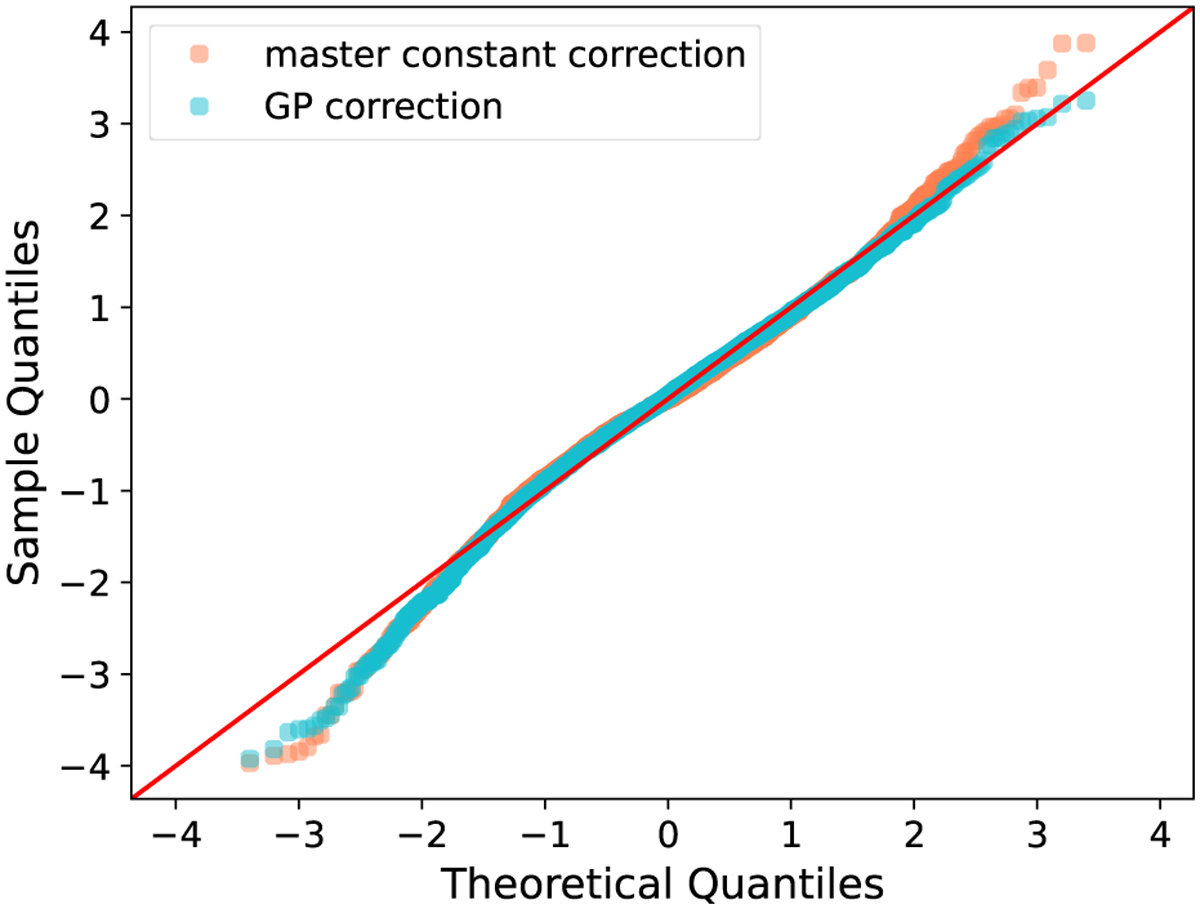
Quantile–quantile analysis comparing the quantile of the residuals for the master constant correction (orange dots) and the GP master constant correction (blue dots) with the corresponding theoretical quantile of a normal distribution. When the cumulative distribution of the residuals follows a normal distribution, the residuals should be aligned along a 45° line (red line).
Current usage metrics show cumulative count of Article Views (full-text article views including HTML views, PDF and ePub downloads, according to the available data) and Abstracts Views on Vision4Press platform.
Data correspond to usage on the plateform after 2015. The current usage metrics is available 48-96 hours after online publication and is updated daily on week days.
Initial download of the metrics may take a while.